. 2013 Nov;521(16):3666-701.
doi: 10.1002/cne.23406.

Molecular profiling of the developing avian telencephalon: regional timing and brain subdivision continuities

Affiliations

Molecular profiling of the developing avian telencephalon: regional timing and brain subdivision continuities

Chun-Chun Chen et al. J Comp Neurol. 2013 Nov.

Abstract

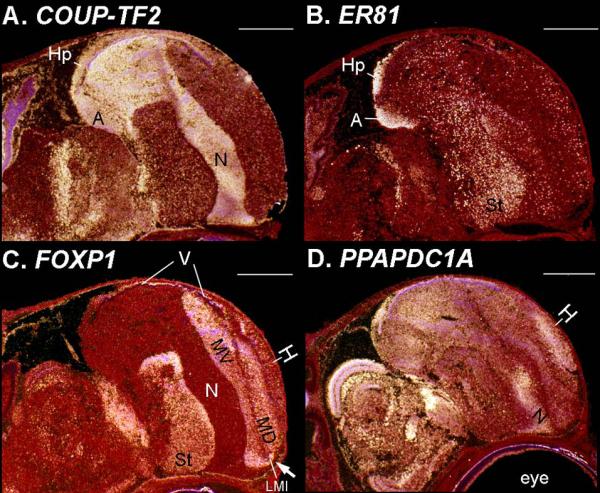
In our companion study (Jarvis et al. [2013] J Comp Neurol. doi: 10.1002/cne.23404) we used quantitative brain molecular profiling to discover that distinct subdivisions in the avian pallium above and below the ventricle and the associated mesopallium lamina have similar molecular profiles, leading to a hypothesis that they may form as continuous subdivisions around the lateral ventricle. To explore this hypothesis, here we profiled the expression of 16 genes at eight developmental stages. The genes included those that define brain subdivisions in the adult and some that are also involved in brain development. We found that phyletic hierarchical cluster and linear regression network analyses of gene expression profiles implicated single and mixed ancestry of these brain regions at early embryonic stages. Most gene expression-defined pallial subdivisions began as one ventral or dorsal domain that later formed specific folds around the lateral ventricle. Subsequently a clear ventricle boundary formed, partitioning them into dorsal and ventral pallial subdivisions surrounding the mesopallium lamina. These subdivisions each included two parts of the mesopallium, the nidopallium and hyperpallium, and the arcopallium and hippocampus, respectively. Each subdivision expression profile had a different temporal order of appearance, similar in timing to the order of analogous cell types of the mammalian cortex. Furthermore, like the mammalian pallium, expression in the ventral pallial subdivisions became distinct during prehatch development, whereas the dorsal portions did so during posthatch development. These findings support the continuum hypothesis of avian brain subdivision development around the ventricle and influence hypotheses on homologies of the avian pallium with other vertebrates.

Keywords: COUP-TF2; FOXP1; LHX9; PPAPPDC1A; ROR-β; anatomical gene expression networks; brain evolution; embryo; in situ hybridization; pallium; subpallium; zebra finch.


Figures

Figure 1
Figure 1
Development of zebra finch embryos. A: Development of zebra finch embryo morphology and the corresponding Hamburger-Hamilton stages. Embryonic day (ED) indicates the days of the incubation. Each panel includes separated upper and lower limbs in right side, used for staging. Scale bar = 2 mm, except 0.5mm at ED2. B: Correlation between Hamburger Hamilton stages and zebra finch embryonic days until the hatch day (ED13). Each dot is the value of one embryo (n = 94). A little under half of the dots overlapped due to very similar values at each developmental stage. A reduced version of this plot up to ED4 was reported in Chen et al. (2012a).
Figure 2
Figure 2
Expression of gene markers in the primordial pallium and subpallium in sagittal sections at medial telencephalon levels of ED4 zebra finch embryos. Rostral is oriented to the right. A-B: EMX2 (A) and PAX6 (B) are expressed continuously in the pallium (Pa). Note a decreased gradient of EMX2 and PAX6 expression from the anterior pallium to the anterior subpallium. C: NKX2.1 is expressed in the subpallium (SPa). D: LHX8 is expressed in a superficial layer of ventral subpallium. E-F: DLX1 (E) and DLX6 (F) are expressed in the subventricular zone of the ventral subpallium. Note that DLX1 and DLX6 expression overlaps with EMX2 expression in an anterior portion of the subpallium. Gray axes show the orientation of each section (D: dorsal; V: ventral; A: anterior; P: posterior). White, mRNA signal. Red, cresyl violet label (Nissl stain). Scale bar = 500 μm.
Figure 3
Figure 3
Time series expression of pallial ventricular zone genes. The panels from right to left across each page are sagittal sections from ED4 to adult. Right is oriented rostrally. A-B: EMX2 (A) and PAX6 (B) are expressed strongly in the dorsal ventricular zone (white arrowheads) through all development stages. Yellow arrow points to junction between the posterior ventricle location and brain where EMX2 cells are thought to migrate out of; yellow arrow head points to dissociated cells for PAX6. C: Brightfield Nissl stained sections of in-situ hybridizations with EMX2 showing the Nissl-defined regions examined in this study. The magnifications of panels C1-C2 are different, in order to highlight the regions of interest. Scale bar = 500 μm, except 2 mm in adult panels.
Figure 3
Figure 3
Time series expression of pallial ventricular zone genes. The panels from right to left across each page are sagittal sections from ED4 to adult. Right is oriented rostrally. A-B: EMX2 (A) and PAX6 (B) are expressed strongly in the dorsal ventricular zone (white arrowheads) through all development stages. Yellow arrow points to junction between the posterior ventricle location and brain where EMX2 cells are thought to migrate out of; yellow arrow head points to dissociated cells for PAX6. C: Brightfield Nissl stained sections of in-situ hybridizations with EMX2 showing the Nissl-defined regions examined in this study. The magnifications of panels C1-C2 are different, in order to highlight the regions of interest. Scale bar = 500 μm, except 2 mm in adult panels.
Figure 4
Figure 4
Phylo-gene expression tree analyses of telencephalic organization at different development stages. A: Phylo-gene expression tree and heat map of adult brain regions (y-axis) for 14 genes (x-axis). In the tree, similar colors indicate shared expression profiles between brain areas, such as yellow for the hippocampus and arcopallium, with the topography indicated in the diagram in the upper left of an adult avian sagittal brain section. In the heat map, the color of the boxes indicates relative expression levels (red, higher than the average for that region relative to other regions; blue, lower than the average). The bootstrap probability (BP; green) values and the approximately unbiased probability (AU; red) values are listed in each branch, as well as distances at each node. A small correlation distance between areas indicates a high similarity in brain gene expression patterns (= 1-correlation values). The scale bar below the phylo-gene expression tree shows the branch distance. B-G: Phylo-gene expression trees for the same genes at (B) P1, (C) ED12, (D) ED10, (E) ED8, (D) ED6, and (G) ED4. H-J: Sagittal sections using the COUP-TF2 pattern to show the numbered regions (R1-R9) we measured telencephalic gene expression at (H) ED8, (I) ED6, and (J) ED4. Scale bars = 500μm.
Figure 5
Figure 5
Telencephalic phylo-gene expression trees from different methods and numbers of genes. A-F: Comparison of trees generated with the continuous (A, D), normalized (B, E) or discretized (C, F) gene expression data at two example ages, adult and ED10. G-J: Adult trees with fewer genes than 14, minus (G) OTX2 (H) OTX2, DLX1, and SEMA6A, (I) OTX2, DLX1, SEMA6A, and LHX8, or (J) OTX2, DLX1, SEMA6A, LHX8 and ER81.
Figure 6
Figure 6
Linear regression, anatomical expression network of avian telencephalic development. Abbreviated names separated by an “_” in each circle are the regions that have significantly similar expression profiles within each age (correlation > 0.7; p < 0.05). The thickness of the line between developmental stages is scaled to the correlation of the expression profiles between ages. The colors of the circle represent each developmental stage. R1-R9 designate our numbered divisions of the early embryonic telencephalon as in Figure 4E-G.
Figure 7
Figure 7
Time series expression of arcopallial and hippocampal enriched genes. A-B: Medial and lateral sections showing the LHX9 expressing region around the caudal ventricle that forms the hippocampus (white arrows) dorsal medially and the arcopallium (yellow arrows) ventral laterally. There is also a gradient of lower expression in the caudal nidopallium adjacent to the arcopallium (B7, white arrowhead). C-D: Medial and lateral sections of ER81 expression, showing similar regions. Although the final adult ER81 pattern is similar to LHX9, the trajectory of the developmental expression profile is different. The arrows in panels C2 and D2 points to such a transient dorsal ventricle expression zone of ER81 cells; the white arrowheads in D6 and D7 points to the lack of high expression in the anterior arcopallium. Scale bar = 500 μm, except 2 mm in adult panels.
Figure 7
Figure 7
Time series expression of arcopallial and hippocampal enriched genes. A-B: Medial and lateral sections showing the LHX9 expressing region around the caudal ventricle that forms the hippocampus (white arrows) dorsal medially and the arcopallium (yellow arrows) ventral laterally. There is also a gradient of lower expression in the caudal nidopallium adjacent to the arcopallium (B7, white arrowhead). C-D: Medial and lateral sections of ER81 expression, showing similar regions. Although the final adult ER81 pattern is similar to LHX9, the trajectory of the developmental expression profile is different. The arrows in panels C2 and D2 points to such a transient dorsal ventricle expression zone of ER81 cells; the white arrowheads in D6 and D7 points to the lack of high expression in the anterior arcopallium. Scale bar = 500 μm, except 2 mm in adult panels.
Figure 8
Figure 8
Time series expression of nidopallial, hyperpallial, and mesopallial enriched genes. A: COUP-TF2 with strong and consistently enriched expression in the nidopallium, arcopallium, and hippocampus, through embryonic development until adulthood. B:PPAPDC1A expression in the primordial nidopallium (B3, white arrow) and the hyperpallium (B4, white arrowhead). C: SEMA6A expression with a less consistent but overlapping profile (arrows) as PPAPDC1A. D: FOXP1 with consistent expression in the primordial mesopallial regions (white arrows) and striatum (yellow arrows) from ED8 onward (D3-D7). Scale bar = 500 μm, except 2 mm in adult panels.
Figure 8
Figure 8
Time series expression of nidopallial, hyperpallial, and mesopallial enriched genes. A: COUP-TF2 with strong and consistently enriched expression in the nidopallium, arcopallium, and hippocampus, through embryonic development until adulthood. B:PPAPDC1A expression in the primordial nidopallium (B3, white arrow) and the hyperpallium (B4, white arrowhead). C: SEMA6A expression with a less consistent but overlapping profile (arrows) as PPAPDC1A. D: FOXP1 with consistent expression in the primordial mesopallial regions (white arrows) and striatum (yellow arrows) from ED8 onward (D3-D7). Scale bar = 500 μm, except 2 mm in adult panels.
Figure 9
Figure 9
Time series expression of intercalated pallial enriched genes. A-B: Medial and lateral sections of ROR-β expression, showing higher levels in the primordial sensory thalamic input neurons of the telencephalon (L2, E, B, and IH) from ED8 onward (A3-7 and B3-7, yellow arrowheads). High expression is also seen in parts of the dorsal thalamus (DLM region), in the mesopallium, and parts of the ventral ventricular zone between ED6-ED8 (A2-3 and B2-3, white arrows). C: GRIN2D expression with a similar pattern for the intercalated pallium regions (yellow arrows), but without high expression in the mesopallium, and instead higher expression in the pallidum (white arrowhead) and brainstem. Scale bar = 500 μm, except 2 mm in adult panels.
Figure 9
Figure 9
Time series expression of intercalated pallial enriched genes. A-B: Medial and lateral sections of ROR-β expression, showing higher levels in the primordial sensory thalamic input neurons of the telencephalon (L2, E, B, and IH) from ED8 onward (A3-7 and B3-7, yellow arrowheads). High expression is also seen in parts of the dorsal thalamus (DLM region), in the mesopallium, and parts of the ventral ventricular zone between ED6-ED8 (A2-3 and B2-3, white arrows). C: GRIN2D expression with a similar pattern for the intercalated pallium regions (yellow arrows), but without high expression in the mesopallium, and instead higher expression in the pallidum (white arrowhead) and brainstem. Scale bar = 500 μm, except 2 mm in adult panels.
Figure 10
Figure 10
Medial-lateral anatomical profiles of adult pallial enriched genes at ED4. Sagittal brain sections of zebra finch embryos from medial (top) to lateral (bottom) shows development of expression of the pallial subdivision defining genes of (A) LHX9, (B) COUP-TF2, (C) PPAPDC1A, (D) FOXP1, and (E) ROR-β. (F) NKX2.1 is shown for comparative purposes for the location of the subpallium (SPa). Note only LHX9 and COUP-TF2 show high expression levels at this age, where the arcopallium (A) and hippocampus (Hp) begin.
Figure 11
Figure 11
Medial-lateral anatomical profiles of adult pallial enriched genes at ED6. Sagittal brain sections of zebra finch embryos from medial (top) to lateral (bottom) shows development of (A) LHX9, (B) COUP-TF2, (C) PPAPDC1A, (D) FOXP1, and (E) ROR-β gene expression. Note that PPAPDC1A begins to show high expression in the ventral-lateral pallium, where the caudal nidopallium (Nc) appears to begin.
Figure 12
Figure 12
Medial-lateral anatomical profiles of adult pallial enriched genes at ED8. Sagittal brain sections of zebra finch embryos from medial (top) to lateral (bottom) shows development of (A) LHX9, (B) COUP-TF2, (C) PPAPDC1A, (D) FOXP1, and (E) ROR-β gene expression. Note that PPAPDC1A expression begins to migrate into the dorsal pallium above the ventricle, FOXP1 begins to show high expression in the dorsal pallium where the primordial dorsal mesopallium appears to begin (yellow arrows), and ROR-β starts to label the primary sensory intercalated pallium zones in the most anterior part of the telencephalon (white arrowhead).
Figure 13
Figure 13
Medial-lateral anatomical profiles of adult pallial enriched genes at ED10. Sagittal brain sections of zebra finch embryos from medial (top) to lateral (bottom) shows development of (A) LHX9, (B) COUP-TF2, (C) PPAPDC1A, (D) FOXP1, and (E) ROR-β gene expression. Note that at this age PPAPDC1A expression enters the future hyperpallium regions in the dorsal pallium overlapping with part of the FOXP1 dorsal mesopallium region (yellow arrows), and the anterior portion of the FOXP1 dorsal mesopallium region begins to bulge into the ventral pallium where part of the future ventral mesopallium is located. Also seen is an expansion of the ROR-β label for the primary sensory intercalated pallium zones (white arrowhead).
Figure 14
Figure 14
Medial-lateral anatomical profiles of adult pallial enriched genes at ED12. Sagittal brain sections of zebra finch embryos from medial (top) to lateral (bottom) shows development of (A) LHX9, (B) COUP-TF2, (C) PPAPDC1A, (D) FOXP1, and (E) ROR-β gene expression. Note that PPAPDC1A dorsal hyperpallium labeled region is still mixed in with the FOXP1 dorsal mesopallium region (yellow arrows), and the anterior-ventral portion of the FOXP1 region has expanded to where the future ventral mesopallium is located, taking on the MV shape as seen in adults. Also seen is a further expansion of the ROR-β the primary sensory intercalated pallium zones dorsally (white arrowhead), but still with some regions contained within the FOXP1 mesopallium-like region.
Figure 15
Figure 15
Medial-lateral anatomical profiles of adult pallial enriched genes at P1. Sagittal brain sections of zebra finch embryos from medial (top) to lateral (bottom) shows development of (A) LHX9, (B) COUP-TF2, (C) PPAPDC1A, (D) FOXP1, and (E) ROR-β gene expression. Note that PPAPDC1A dorsal primordial hyperpallium region starts to show decreased FOXP1 expression, but the majority is still mixed in with the FOXP1 dorsal mesopallium-like region (yellow arrows); the FOXP1 ventral mesopallium region is more similar to its adult form and does not overlap with PPAPDC1A. Also seen is a weak expansion of the ROR-β primary sensory intercalated pallium zones (white arrowhead).
Figure 16
Figure 16
Examples of continuities of expression around the lateral ventricle at P1. Gray arrows indicate the ventricular enclosure area. Black arrows and arrow heads points the gene expression in one side and the other side of the ventricle. A: Sagittal brain section of LHX9 expression around the posterior lateral ventricle fold indicates where there is continuity surrounding the ventricle. B: FOXP1 expression from the same embryo around the anterior ventricle fold that forms the two halves of the mesopallium. C: NKX2.1 expression around the ventral lateral ventricle in the location of the striatum. D: Lower magnification of NKX2.1 expression shows high levels around the ventral posterior-medial fold in the ventricle (c) for the pallidum and medial septum; this image also shows the relative positions of other ventricle folds (a and b). Each box with the lower case letters (a, b and c) indicates the relative location of each panel. E: Darkfield image of FoxP1 expression at P6 showing that the ependymal epithelial cells in the ventricle no longer exist in the LMI lamina between MD and MV after ventricle seals up. F: Brightfield image of thicker sections (40 μm) in adult showing the difference in the ventricular surface ependymal cells and the LMI lamina, but still continuity between the two. Scale bars = 200 μm (A-D) and 500 μm (E-F).
Figure 17
Figure 17
Pallial subdivision defining genes at P6. A: ER81 at P6 is expressed in hippocampus and arcopallium, but scattered labeled cells are found in the pallidum, striatum, and non-mesopallium parts of the pallium, approaching the pattern found in adulthood. B: COUP-TF2 expression in the nidopallium, arcopallium, and hippocampus. C: FOXP1 expression with now clearly defined dorsal and ventral mesopallium label around the LMI lamina and ventricle, separate from the hyperpallium. White arrow, continuity between dorsal and ventral mesopallium. D: PPAPDC1A starts to show more enriched expression in anterior parts of the hyperpallium and nidopallium. Scale bar = 1mm.
Figure 18
Figure 18
Time series expression of subpallial enriched genes. A: DLX6 expression showing pallidal (white arrowhead) and striatal (white arrow) locations from ED4 to adulthood, with reduced expression in the adult pallidum. DLX6 also has some expression in caudal nidopallium (yellow arrow) and the thalamus from ED6 to P1, but is reduced in these regions in adults. B: D1B expression at high levels mainly in the striatum from ED8 onward. C: LHX8 expression at high levels in the pallidum (white arrowhead) and striatum from ED4-P1 (C1-7), and then down regulated in the striatum of adults. D: DLX1 shows a migrating pattern of expression from the primordial pallidum at ED4 (D1), to the striatum, then nidopallium and arcopallium, and then finally enrichment in the hippocampus in adulthood (D7). E: NKX2.1 shows a migrating, spreading pattern from the primordial pallidum at ED4 (E1, white arrowhead), to the striatum (white arrow), to ventral pallial regions, and finally to dorsal pallium regions in adults, except for the mesopallium. F: OTX2 shows high levels in the brainstem from ED4 (F1) to adulthood (F7), demarcating the boundary between the telencephalon and thalamus (white arrows). Scale bar = 500 μm, except 2 mm in adult panels.
Figure 18
Figure 18
Time series expression of subpallial enriched genes. A: DLX6 expression showing pallidal (white arrowhead) and striatal (white arrow) locations from ED4 to adulthood, with reduced expression in the adult pallidum. DLX6 also has some expression in caudal nidopallium (yellow arrow) and the thalamus from ED6 to P1, but is reduced in these regions in adults. B: D1B expression at high levels mainly in the striatum from ED8 onward. C: LHX8 expression at high levels in the pallidum (white arrowhead) and striatum from ED4-P1 (C1-7), and then down regulated in the striatum of adults. D: DLX1 shows a migrating pattern of expression from the primordial pallidum at ED4 (D1), to the striatum, then nidopallium and arcopallium, and then finally enrichment in the hippocampus in adulthood (D7). E: NKX2.1 shows a migrating, spreading pattern from the primordial pallidum at ED4 (E1, white arrowhead), to the striatum (white arrow), to ventral pallial regions, and finally to dorsal pallium regions in adults, except for the mesopallium. F: OTX2 shows high levels in the brainstem from ED4 (F1) to adulthood (F7), demarcating the boundary between the telencephalon and thalamus (white arrows). Scale bar = 500 μm, except 2 mm in adult panels.
Figure 19
Figure 19
Possible early origin of the RA song nucleus. A: EMX2 gene expression, which is higher in adult RA, shows higher expression in the caudal arcopallium (surround by white arrows) at P1 with the same shape as the RA nucleus of adults. B: LHX9 expression in an adjacent section shows the boundaries of the arcopallium and slightly lower expression in the location of the specialized EMX2 region (black arrows). C: ER81 expression in an adjacent section.
Figure 20
Figure 20
A model of avian telencephalic development. A-F: Temporal and anatomical progression of regions with shared gene expression profiles (colors) from ED4 to adulthood. Right is oriented anterior. Not all brains regions are generated in the same plane of section. For example, the mesopallium marker patterns are positioned more medial than the nidopallium+hyperpallium marker patterns, and they partly overlap in the central medial-lateral location of the lateral telencephalon. Thus this model represents a compressed view for each developmental age. See main text for explanation of the model. Further details on the chronological appearance of expression markers are summarized in Table 3.
Figure 21
Figure 21
Comparison with Cartesian-defined model of avian cerebral organization. Shown are coronal views of an adult pigeon brain (A, B) and sagittal views of an adult songbird brain (C, D) with the brain subdivisions colored coded according to a recent vision of Cartesian defined subdivisions (A, C) and the phyletic quantitative gene expression and continuum model (B, D) of this and the companion study (Jarvis et al 2013). The center of coordinates is placed in the ventricle at the level of the LMI lamina, with the x-axis parallel to LMI and the y-axis parallel to the dorsal-ventral position of the ventricle. In these views, regardless of how the regions are named, most non-hippocampus/arcopallium pallial regions extend from the lateral wall of the ventricle to the lateral surface of the telencephalon. Solid white lines are laminas that separate subdivisions. Dashed black lines divide regions within a subdivision, whether a lamina is present or not. Dashed gray lines show the Cartesian coordinate axes (A: anterior; D: dorsal; L: lateral; M: medial; P: posterior; V: ventral).
Figure 22
Figure 22
Avian cerebral organization and its mammalian homologies according to different hypotheses. A: Color-coded scheme of the avian brain in our organization model. B: Color-coded scheme of the rodent brain according to the nuclear-to-layered hypothesis of homology with the avian brain. C: Color-coded scheme of the rodent brain according to the nuclear-to-claustrum/amgydala hypothesis of homology with the avian brain. D: Color-coded scheme of the rodent brain according to a field hypothesis of homology with the avian brain proposed in this study.

Comment in

References

    1. Abellan A, Medina L. Subdivisions and derivatives of the chicken subpallium based on expression of LIM and other regulatory genes and markers of neuron subpopulations during development. J Comp Neurol. 2009;515(4):465–501. - PubMed
    1. Aboitiz F. Genetic and developmental homology in amniote brains. Toward conciliating radical views of brain evolution. Brain Res Bull. 2011;84(2):125–136. - PubMed
    1. Atoji Y, Wild JM. Anatomy of the avian hippocampal formation. Rev Neurosci. 2006;17(1-2):3–15. - PubMed
    1. Bardet SM, Cobos I, Puelles E, Martinez-De-La-Torre M, Puelles L. Chicken lateral septal organ and other circumventricular organs form in a striatal subdomain abutting the molecular striatopallidal border. J Comp Neurol. 2006;499(5):745–767. - PubMed
    1. Bardet SM, Ferran JL, Sanchez-Arrones L, Puelles L. Ontogenetic expression of sonic hedgehog in the chicken subpallium. Front Neuroanat. 2010;4 - PMC - PubMed