

Chromatin in a marine picoeukaryote is a disordered assemblage of nucleosomes
- PMID: 23818178
- PMCID: PMC3777167
- DOI: 10.1007/s00412-013-0423-z
Chromatin in a marine picoeukaryote is a disordered assemblage of nucleosomes
Abstract
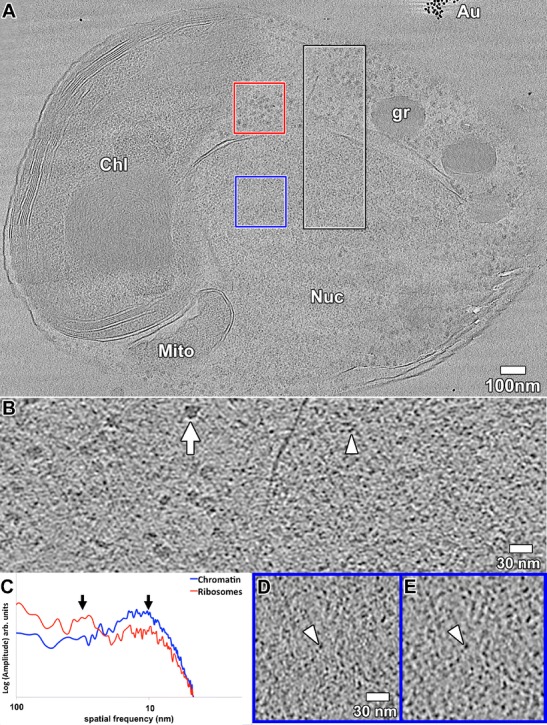
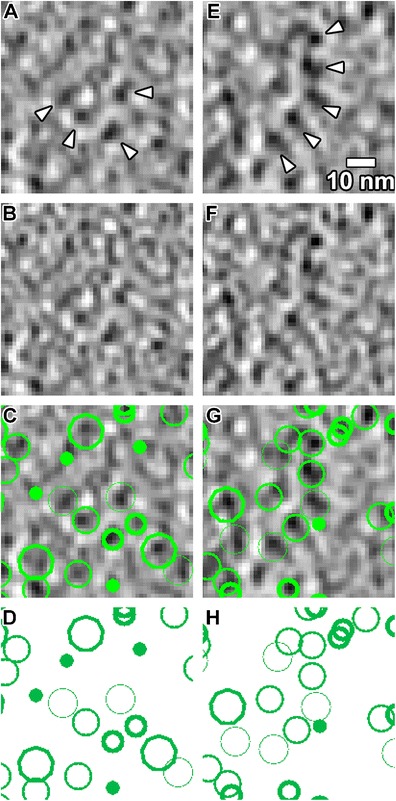
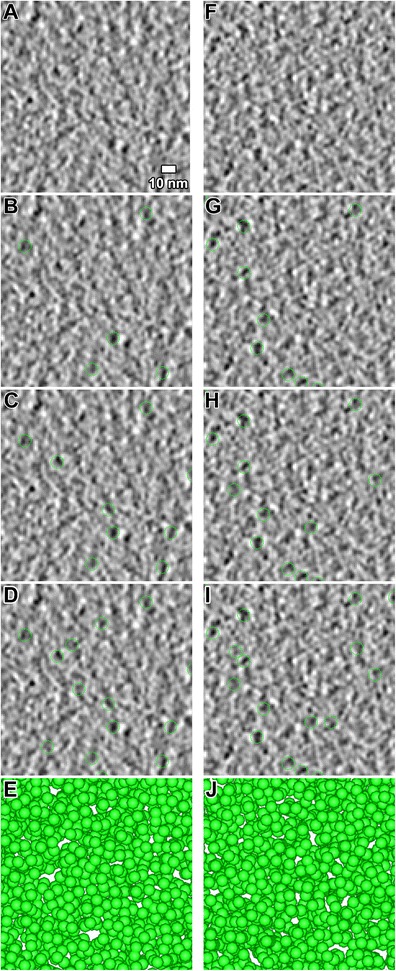
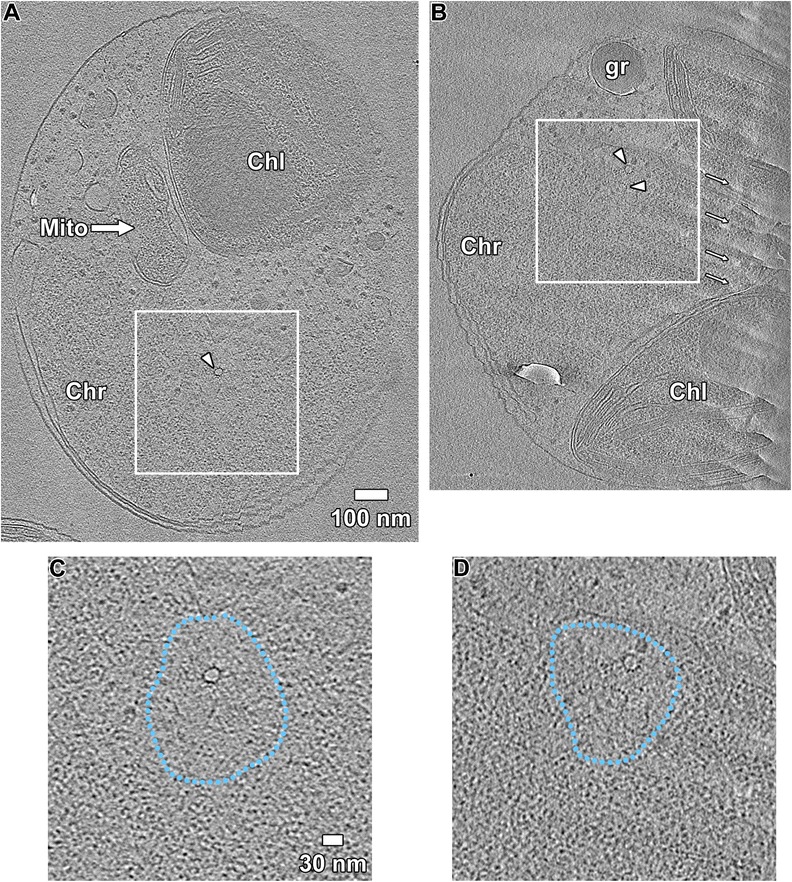
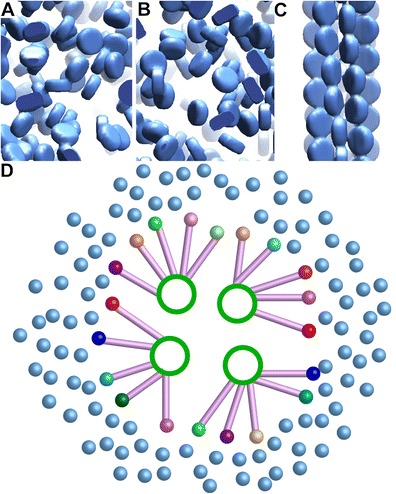
Chromatin organization is central to many conserved biological processes, but it is generally unknown how the underlying nucleosomes are arranged in situ. Here, we have used electron cryotomography to study chromatin in the picoplankton Ostreococcus tauri, the smallest known free-living eukaryote. By visualizing the nucleosome densities directly, we find that O. tauri chromosomes do not arrange into discrete, compact bodies or any other higher level of order. In contrast to the textbook 30-nm fiber model, O. tauri chromatin resembles a disordered assemblage of nucleosomes akin to the polymer melt model. This disorganized nucleosome arrangement has important implications for potentially conserved functions in tiny eukaryotes such as the clustering of nonhomologous chromosomes at the kinetochore during mitosis and the independent regulation of closely positioned adjacent genes.
Figures
Similar articles
-
Cryo-ET reveals the macromolecular reorganization of S. pombe mitotic chromosomes in vivo.Proc Natl Acad Sci U S A. 2018 Oct 23;115(43):10977-10982. doi: 10.1073/pnas.1720476115. Epub 2018 Oct 8. Proc Natl Acad Sci U S A. 2018. PMID: 30297429 Free PMC article.
-
3-D ultrastructure of O. tauri: electron cryotomography of an entire eukaryotic cell.PLoS One. 2007 Aug 15;2(8):e749. doi: 10.1371/journal.pone.0000749. PLoS One. 2007. PMID: 17710148 Free PMC article.
-
Budding yeast chromatin is dispersed in a crowded nucleoplasm in vivo.Mol Biol Cell. 2016 Nov 1;27(21):3357-3368. doi: 10.1091/mbc.E16-07-0506. Epub 2016 Sep 7. Mol Biol Cell. 2016. PMID: 27605704 Free PMC article.
-
Electron microscopy and atomic force microscopy studies of chromatin and metaphase chromosome structure.Micron. 2011 Dec;42(8):733-50. doi: 10.1016/j.micron.2011.05.002. Epub 2011 May 12. Micron. 2011. PMID: 21703860 Review.
-
Mesoscale organization of the chromatin fiber.Curr Opin Genet Dev. 2020 Apr;61:32-36. doi: 10.1016/j.gde.2020.02.022. Epub 2020 Apr 16. Curr Opin Genet Dev. 2020. PMID: 32305817 Review.
Cited by
-
Chromatin as a nuclear spring.Biophys Physicobiol. 2018 Sep 11;15:189-195. doi: 10.2142/biophysico.15.0_189. eCollection 2018. Biophys Physicobiol. 2018. PMID: 30349803 Free PMC article. Review.
-
Cryo-ET reveals the macromolecular reorganization of S. pombe mitotic chromosomes in vivo.Proc Natl Acad Sci U S A. 2018 Oct 23;115(43):10977-10982. doi: 10.1073/pnas.1720476115. Epub 2018 Oct 8. Proc Natl Acad Sci U S A. 2018. PMID: 30297429 Free PMC article.
-
Nucleosomal arrays self-assemble into supramolecular globular structures lacking 30-nm fibers.EMBO J. 2016 May 17;35(10):1115-32. doi: 10.15252/embj.201592660. Epub 2016 Apr 12. EMBO J. 2016. PMID: 27072995 Free PMC article.
-
The in situ structures of mono-, di-, and trinucleosomes in human heterochromatin.Mol Biol Cell. 2018 Oct 1;29(20):2450-2457. doi: 10.1091/mbc.E18-05-0331. Epub 2018 Aug 9. Mol Biol Cell. 2018. PMID: 30091658 Free PMC article.
-
Structural organization of very small chromosomes: study on a single-celled evolutionary distant eukaryote Giardia intestinalis.Chromosoma. 2015 Mar;124(1):81-94. doi: 10.1007/s00412-014-0486-5. Epub 2014 Aug 30. Chromosoma. 2015. PMID: 25171919
References
-
- Alberts B. Molecular biology of the cell. New York: Garland Science; 2008.
Publication types
MeSH terms
Substances
Grants and funding
LinkOut - more resources
Full Text Sources
Other Literature Sources
