

The ZEB1 pathway links glioblastoma initiation, invasion and chemoresistance
- PMID: 23818228
- PMCID: PMC3944461
- DOI: 10.1002/emmm.201302827
The ZEB1 pathway links glioblastoma initiation, invasion and chemoresistance
Abstract
Glioblastoma remains one of the most lethal types of cancer, and is the most common brain tumour in adults. In particular, tumour recurrence after surgical resection and radiation invariably occurs regardless of aggressive chemotherapy. Here, we provide evidence that the transcription factor ZEB1 (zinc finger E-box binding homeobox 1) exerts simultaneous influence over invasion, chemoresistance and tumourigenesis in glioblastoma. ZEB1 is preferentially expressed in invasive glioblastoma cells, where the ZEB1-miR-200 feedback loop interconnects these processes through the downstream effectors ROBO1, c-MYB and MGMT. Moreover, ZEB1 expression in glioblastoma patients is predictive of shorter survival and poor Temozolomide response. Our findings indicate that this regulator of epithelial-mesenchymal transition orchestrates key features of cancer stem cells in malignant glioma and identify ROBO1, OLIG2, CD133 and MGMT as novel targets of the ZEB1 pathway. Thus, ZEB1 is an important candidate molecule for glioblastoma recurrence, a marker of invasive tumour cells and a potential therapeutic target, along with its downstream effectors.
Keywords: EMT; brain; cancer stem cell; glioma; xenograft.
© 2013 The Authors. Published by John Wiley and Sons, Ltd on behalf of EMBO.
Figures
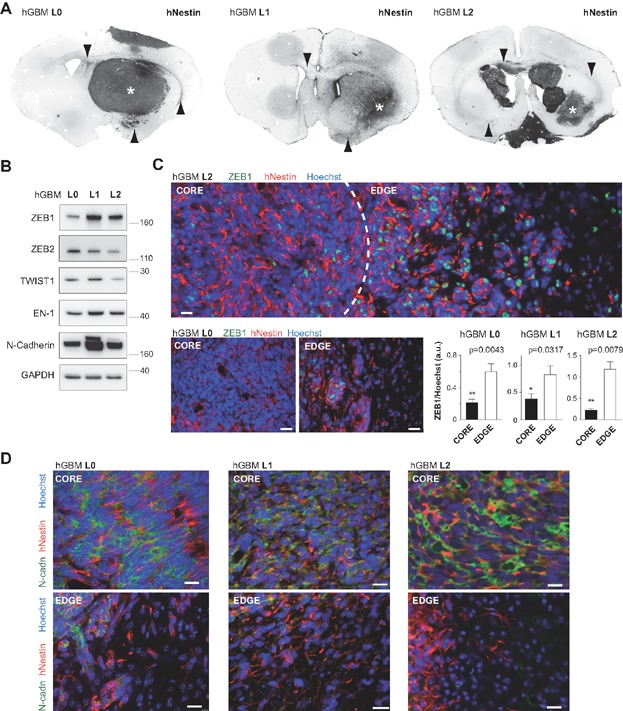
Primary glioblastoma (hGBM) cell lines L0, L1 and L2 show varying degrees of tumour mass (asterisks) and invasion (arrowheads). Images are inverted black and white micrographs of fluorescent immunostainings for human-specific nestin (n = 5 animals each).
EMT factors ZEB1, ZEB2, Twist1 and En-1, as well as N-cadherin are expressed in invasive hGBM cell lines. Additional markers are shown in Supporting Information Fig 1A.
ZEB1 is highly expressed at the invasion front of tumours, but not within the tumuor mass (dotted line separates areas of tumour mass and invasion; single image projection from confocal z-stack, scale bars 20 µm). Bar graphs depict ratios of mean fluorescence intensity at randomly selected tumour core and edge areas (n = 5 each, Mann–Whitney U-test).
While the tumour mass is immunopositive for N-cadherin, invasive cells are negative. Scale bars 20 µm.
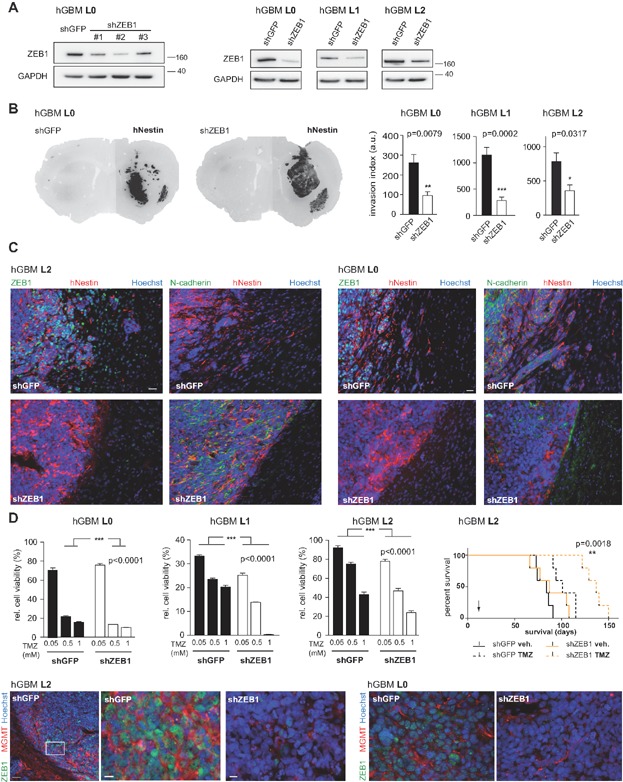
Short hairpin constructs against ZEB1 prominently reduce its protein levels. shZEB1 targets ZEB1 protein in all three primary cell lines.
ZEB1 knockdown results in reduced tumour invasion in all cell lines (n = 5 animals per group, Mann–Whitney U-test). Threshold images used to determine invasion index are shown in Supporting Information Fig S2C.
Control tumours show expression of ZEB1, but not N-cadherin, at the invasion front, while tumours derived from ZEB1 knockdown cells are characterised by high levels of N-cadherin and no invasion. Scale bar 20 µm (applies to all panels).
ZEB1 knockdown results in significantly greater sensitivity to TMZ in MTT cell viability assays (n = 8, one-way ANOVA) and in xenografted tumours (n = 5 animals each, log-rank test, arrow indicates TMZ treatment). Increased ZEB1 expression at the edges of control tumours is associated with expression of MGMT. ZEB1 knockdown tumours do not stain for MGMT. Scale bars 50 µm in left and 10 µm in other panels.
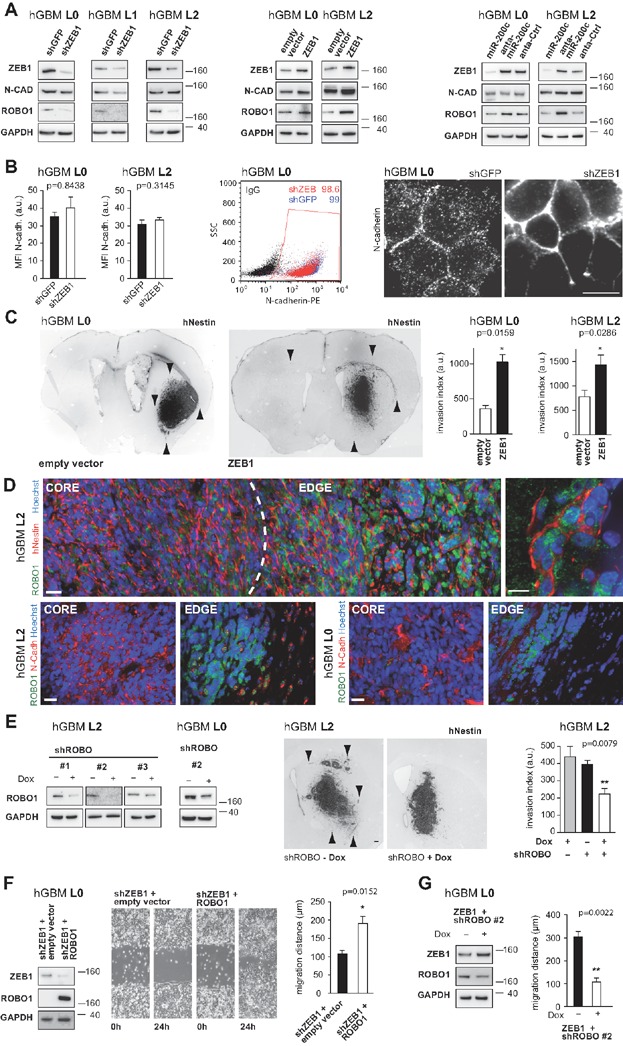
Knockdown of ZEB1 has no effect on total protein levels of N-cadherin, but robustly depletes ROBO1. Forced expression of ZEB1 does not affect N-cadherin, but increases ROBO1 levels. Likewise, modulation of miR-200 expression affects expression of ROBO1.
N-cadherin immunostaining detects similar levels on control and ZEB1 knockdown cells (MFI: mean fluorescence intensity; n = 11, Mann–Whitney U-test; additional images shown in Supporting Information Fig S3). Flow cytometry shows no difference in N-cadherin positive cell numbers in knockdown versus control (extracellular epitope; numbers reflect % positive cells). N-cadherin signal is speckled in control cells, but concentrated at cell–cell contact membranes in ZEB1 knockdown.
Targeted expression of ZEB1 increases tumour invasion (n = 5 animals each, one-way ANOVA; arrowheads point to maximum invasion distances).
ROBO1 is expressed at the tumour edge, and is inversely proportional to the expression of N-Cadherin. High magnification shows ROBO1-positive tumour cells distal to the invasion front. Scale bars, 10 µm.
Inducible short hairpin constructs against ROBO1 can reduce its protein levels in the presence of doxycycline (Dox). shROBO xenografts show reduced invasion in the presence of Dox (n = 5 animals each; one-way ANOVA; arrowheads highlight extent of invasion in control conditions; additional data shown in Supporting Information Fig S3).
ROBO1 rescues migration phenotype in ZEB1 knockdown cells (n = 3 for migration assay; additional data shown in Supporting Information Fig S3).
ROBO1 knockdown depletes migration of ZEB1 overexpressing cells (n = 3, additional data shown in Supporting Information Fig S3).
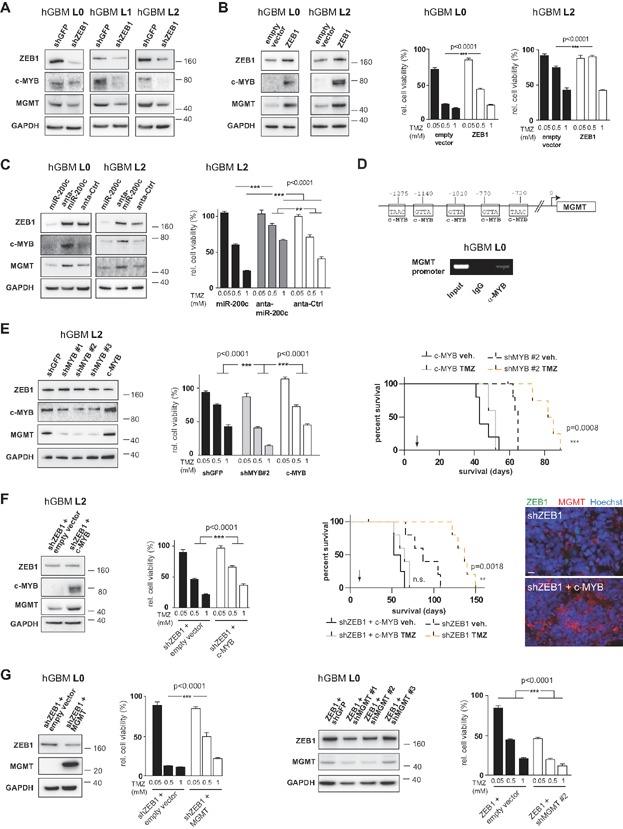
ZEB1 knockdown reduces protein levels of c-MYB and MGMT.
Expression of ZEB1 increases protein levels of c-MYB and MGMT, and results in higher resistance to TMZ in vitro.
miR-200c affects protein expression of ZEB1, c-MYB and MGMT, while antagonising miR-200c has opposite effects. Modulation of miR-200c affects chemoresistance to TMZ (n = 8, one-way ANOVA).
Chromatin immunoprecipitation using anti-MYB antibody demonstrates c-MYB binding to the MGMT promoter in primary glioblastoma cells. Indicated are putative c-MYB binding sites in the MGMT promoter (Ghosh, 2000).
Knockdown of c-MYB reduces expression of MGMT, while overexpression of c-MYB increases MGMT levels. Both have no influence on ZEB1 expression. Resistance to TMZ is significantly reduced by c-MYB knockdown in vitro (n = 8, one-way ANOVA). Ablation of c-MYB increases survival of tumour-bearing animals, while overexpression of c-MYB negates TMZ effects (n = 5 animals each, log rank test). Experiments with an additional cell line are shown in Supporting Information Fig 4.
Chemoresistance in ZEB1-knockdown cells can be rescued by expression of c-MYB (n = 8, one-way ANOVA). Knockdown of ZEB1 and simultaneous expression of c-MYB abolish differences in survival times after TMZ treatment (n = 5 animals each, log-rank test). Tumours from ZEB1 knockdown, c-MYB expressing animals are immunoreactive for MGMT, but not ZEB1. Scale bar, 10 µm (applies to both images)
Chemoresistance in ZEB1 knockdown cells can be rescued by expression of MGMT (n = 8, one-way ANOVA), and chemoresistance of ZEB1 expressing cells can be ablated by knockdown of MGMT (n = 8, one-way ANOVA).
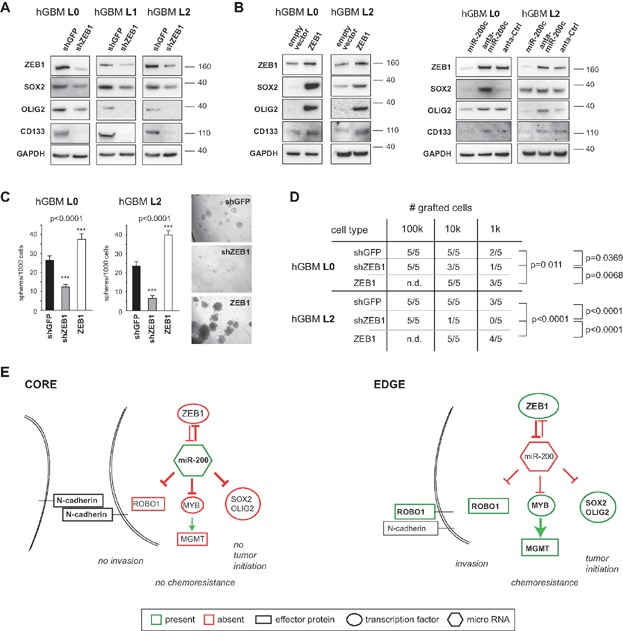
ZEB1 knockdown reduces protein levels of SOX2, OLIG2 and CD133.
Expression of ZEB1 increases protein levels of these proteins. Expression of miR-200c reduces, and antagonising miR-200c increases SOX2, OLIG2 and CD133 levels.
Tumour sphere formation is decreased by ZEB1 knockdown, and increased by its expression (n = 8, one-way ANOVA).
ZEB1 knockdown significantly reduced intracerebral tumour formation, whereas expression of ZEB1 resulted in increased tumour formation frequency (chi square test).
Schematic model depicts interconnection between invasion, chemoresistance and tumour initiation. Invasive cells express high levels of ZEB1, which inhibits the expression of miR-200. ROBO1 and c-MYB are consequently expressed and affect cell adhesion (by way of ROBO1 activity and the disconnection of N-cadherin from the cytoskeleton) and chemoresistance (by way of c-MYB and the induction of MGMT). SOX2 and OLIG2 mediate stemness and tumour initiation capacities in these cells. Non-invasive cells in the tumour mass do not express ZEB1; therefore microRNAs inhibit expression of SOX2, OLIG2, ROBO1 and c-MYB. N-cadherin remains tethered to the cytoskeleton and inhibits cell motility. MGMT is not expressed and cells are more sensitive to TMZ.
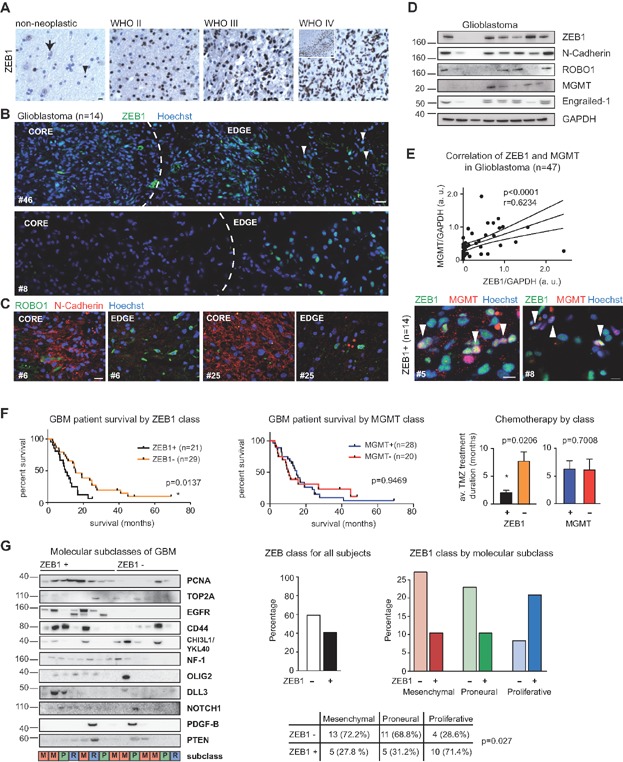
ZEB1 is weakly reactive in some neurons (arrow) and strongly reactive in scattered glial cells (arrowhead) in non-neoplastic parenchyma, and labels glioma cells with increasing frequency and intensity with progressing malignancy (grade II astrocytoma, grade III anaplastic astrocytoma and grade IV glioblastoma; inset in grade IV depicts pseudopalisading necrosis; scale bars 10 µm).
In glioblastoma, ZEB1 expression is highest at the invasive edge, which is mirrored by expression of ROBO1.
N-cadherin is most prominent at the core, and virtually absent at the edge (representative images from 14 cases, scale bars 20 µm). Representative images for ZEB1 negative tumours are shown in Supporting Information Fig S5.
EMT markers ZEB1 and En-1 are expressed in glioblastoma samples, as well as N-cadherin and MGMT. Additional immunoblots for EMT-associated proteins are shown in Supporting Information Fig S6.
Expression of MGMT and ZEB1 are correlated (n = 47, Spearman Correlation). Within ZEB1-expressing tumours, MGMT is frequently co-expressed in ZEB1+ cells (arrowheads; 51 ± 9% co-localisation; n = 14; see also Supporting Information Fig S6). Nuclei are counterstained with Hoechst. Scale bar 10 µm.
Immunoblotting analyses in 50 patient tumour specimens revealed that approx. 40–45% of glioblastomas express ZEB1. This is correlated with clinical outcome (median survival ZEB1+ 10.2 months, ZEB1− 15.7 months, log-rank test). While comparable specimen numbers expressed MGMT, no significant correlation with outcome was found. Response to TMZ treatment (average TMZ treatment duration ZEB1+ 2.0 months, ZEB1− 7.7 months, Mann–Whitney test) was also significantly extended for ZEB1+, but not for MGMT+ specimens.
Stratification of glioblastoma specimens into molecular subclasses revealed a significantly higher portion of ZEB1+ specimens in the proliferative subclass, while more ZEB1− specimens were grouped into the mesenchymal and proneural subclasses. Analysis of individual markers across specimens is presented in Supporting Information Fig S6.
References
-
- Asano K, Duntsch CD, Zhou Q, Weimar JD, Bordelon D, Robertson JH, Pourmotabbed T. Correlation of N-cadherin expression in high grade gliomas with tissue invasion. J Neuro-Oncol. 2004;70:3–15. - PubMed
-
- Bao S, Wu Q, McLendon RE, Hao Y, Shi Q, Hjelmeland AB, Dewhirst MW, Bigner DD, Rich JN. Glioma stem cells promote radioresistance by preferential activation of the DNA damage response. Nature. 2006;444:756–760. - PubMed
-
- Bocangel DB, Finkelstein S, Schold SC, Bhakat KK, Mitra S, Kokkinakis DM. Multifaceted resistance of gliomas to temozolomide. Clin Cancer Res. 2002;8:2725–2734. - PubMed
Publication types
MeSH terms
Substances
Grants and funding
LinkOut - more resources
Full Text Sources
Other Literature Sources
Medical
Research Materials
