. 2013 Jul 16;110(29):11976-81.
doi: 10.1073/pnas.1306180110. Epub 2013 Jul 1.

Diacylglycerol promotes centrosome polarization in T cells via reciprocal localization of dynein and myosin II

Affiliations

Diacylglycerol promotes centrosome polarization in T cells via reciprocal localization of dynein and myosin II

Xin Liu et al. Proc Natl Acad Sci U S A. .

Abstract

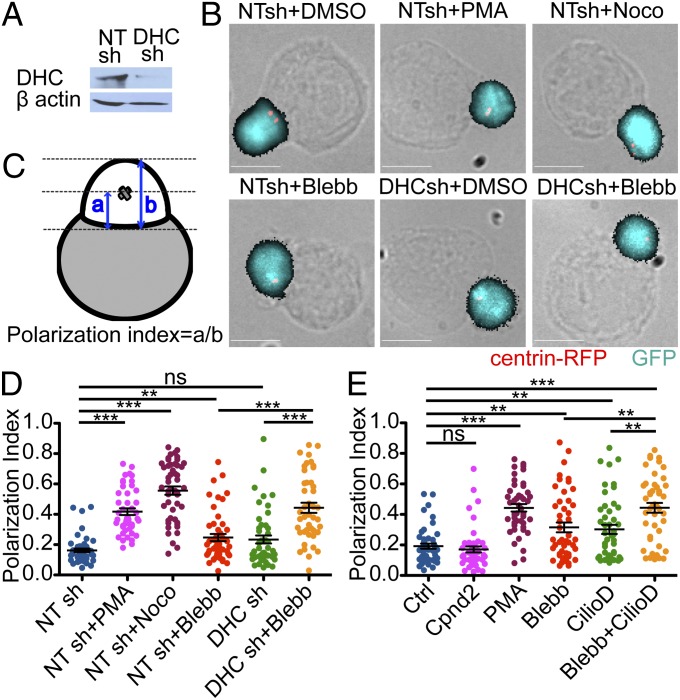
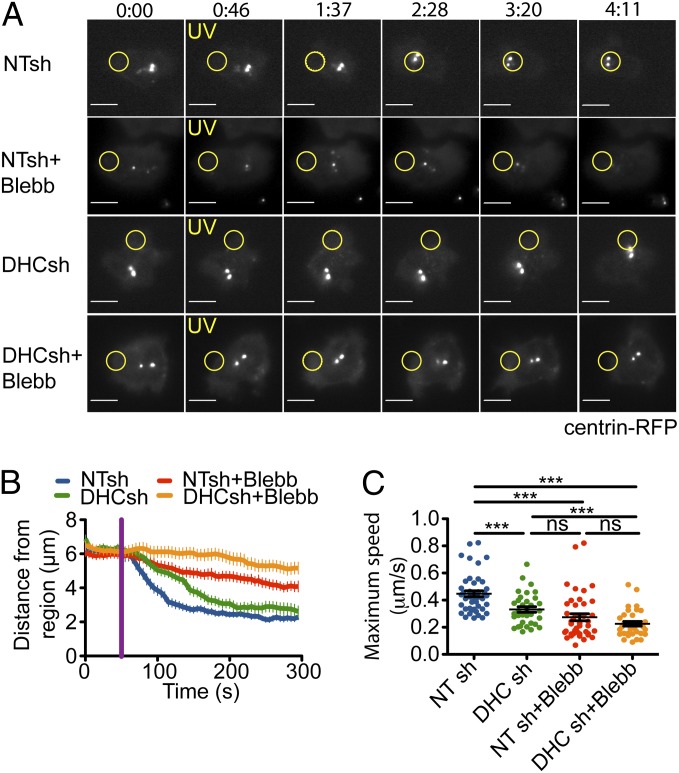
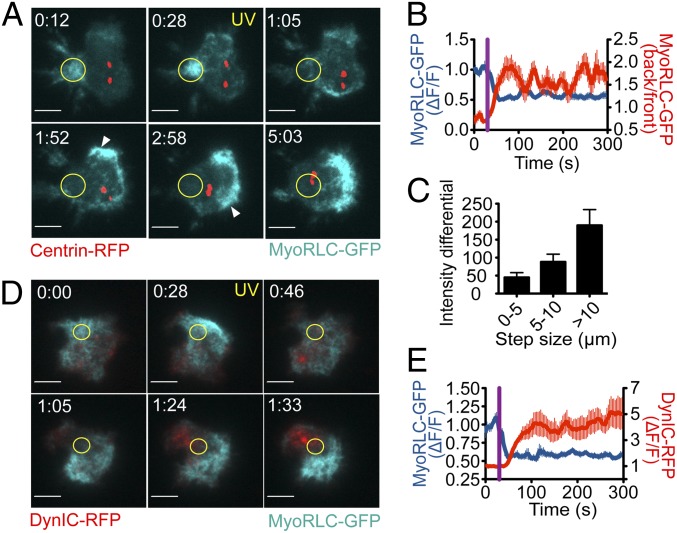
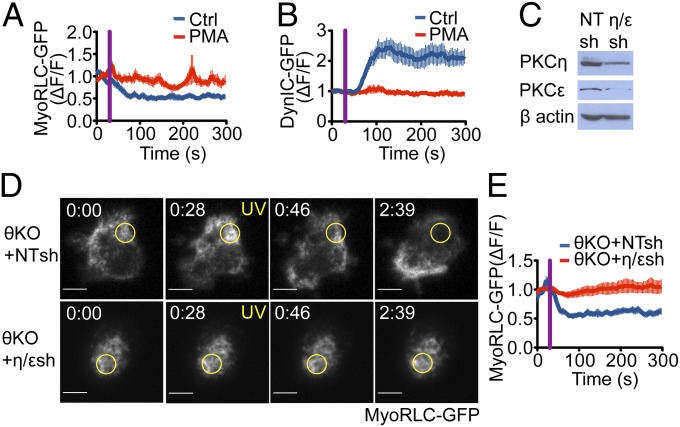
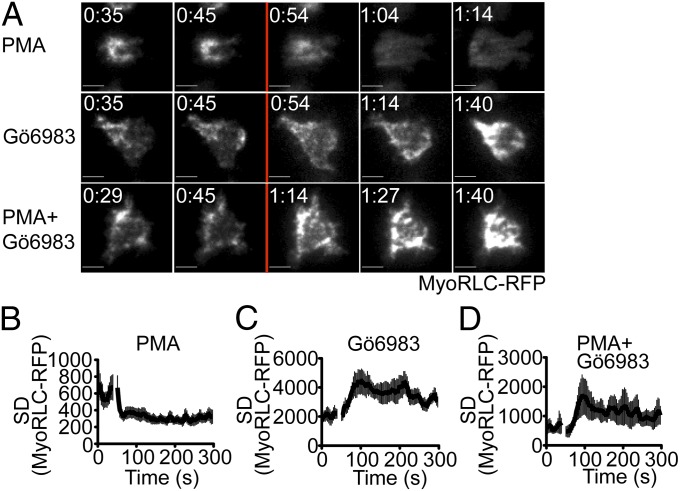
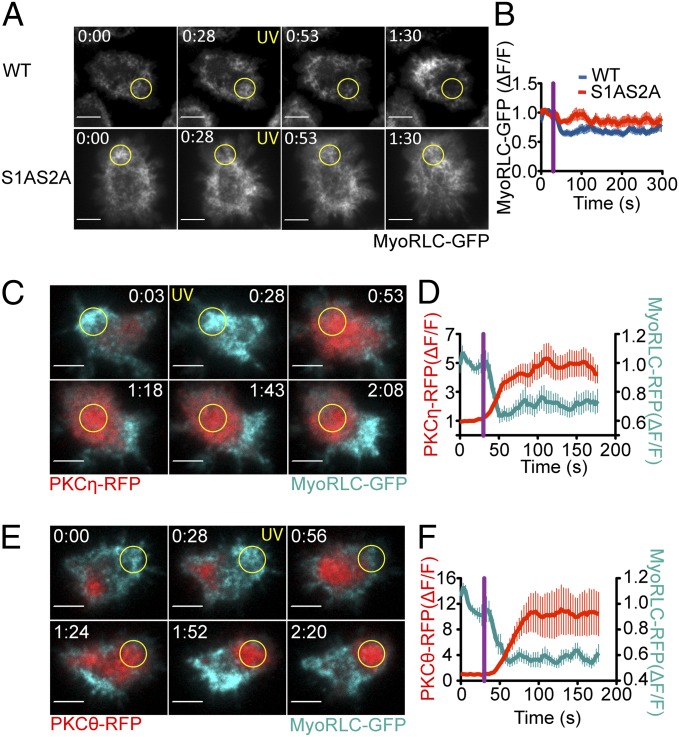
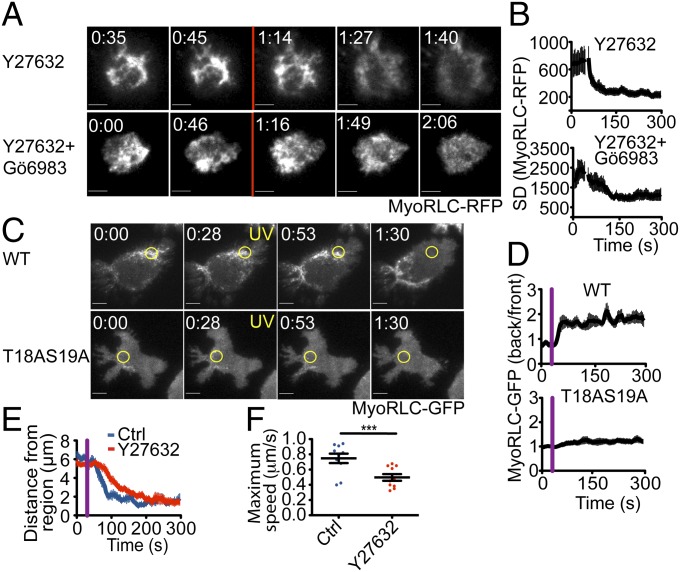
Centrosome reorientation to the immunological synapse maintains the specificity of T-cell effector function by facilitating the directional release of cytokines and cytolytic factors toward the antigen-presenting cell. This polarization response is driven by the localized accumulation of diacylglycerol, which recruits multiple protein kinase (PK)C isozymes to the synaptic membrane. Here, we used T-cell receptor (TCR) photoactivation and imaging methodology to demonstrate that PKCs control centrosome dynamics through the reciprocal localization of two motor complexes, dynein and nonmuscle myosin (NM)II. Dynein accumulated in the region of TCR stimulation, whereas NMII clustered in the back of the cell, behind the polarizing centrosome. PKC activity, which shaped both dynein and NMII accumulation within this framework, controlled NMII localization directly by phosphorylating inhibitory sites within the myosin regulatory light chain, thereby suppressing NMII clustering in the region of TCR stimulation. Concurrently, phosphorylation of distinct sites within myosin regulatory light chain by Rho kinase drove NMII clustering in areas behind the centrosome. These results reveal a role for NMII in T-cell polarity and demonstrate how it is regulated by upstream signals.

Keywords: cytoskeleton; microtubule-organizing center; polarity; signal transduction.


Figures

Fig. 1.
Fig. 1.
Dynein and NMII collaborate during centrosome polarization in T cell–APC conjugates. (AC) T-cell blasts (5C.C7) expressing the indicated GFP-marked shRNAs together with centrin-RFP were mixed with antigen-loaded CH12 cells and imaged after fixation. Cells were treated with 5 ng/mL PMA, 33 μM nocodazole, 50 μM blebbistatin, or vehicle control (DMSO) as indicated. (A) Validation of DHC shRNA knockdown by immunoblot, with β actin serving as a loading control. NT, nontargeting shRNA control. (B) Representative fluorescence images are shown overlaid onto their corresponding bright-field images. (Scale bars: 10 μm.) (C) Schematic showing the calculation of polarization index. (D) Quantification of polarization index in fixed conjugates (n ≥ 44 conjugates per condition). (E) Centrosome polarization in fixed conjugates treated with DMSO vehicle, 5 ng/mL PMA, 50 μM ciliobrevin D, 50 μM negative control compound for ciliobrevin D (compound 2), 50 μM blebbistatin, or 50 μM ciliobrevin D in combination with 50 μM blebbistatin (n ≥ 45 conjugates per condition). Error bars in D and E denote SEM. P values were calculated using the Mann–Whitney test. ***P < 0.001; **P < 0.01; *P ≤ 0.05; ns, P > 0.05.
Fig. 2.
Fig. 2.
Dynein and NMII collaborate to polarize the centrosome in response to TCR photoactivation. Centrosome polarization in T cells treated with nontargeting (NT) shRNA or shRNA against DynHC (DHC), with or without 50 μM blebbistatin. (A) Representative time-lapse montages, with the time of UV irradiation indicated by yellow text. Yellow circles denote the irradiated region in each experiment. Time is indicated as minutes:seconds above the montages. (Scale bars: 5 μm.) (B) Average distance between the photoactivated region and the centrosome over time, with UV irradiation indicated by a purple line. (C) Maximum speed of centrosome movement (n ≥ 34 cells per sample). Error bars denote SEM. P values were calculated using Student t test. ***P < 0.001; **P < 0.01; *P ≤ 0.05; ns, P > 0.05.
Fig. 3.
Fig. 3.
Reciprocal localization of NMII and dynein after TCR activation. Photoactivation experiments were performed using 5C.C7 T cells expressing MyoRLC-GFP together with either centrin-RFP (AC) or DynIC-RFP (D and E). MyoRLC-GFP and DynIC-RFP were imaged using TIRF microscopy, and centrin-RFP was imaged with epifluorescence. (A and D) Representative time-lapse montages, with the time of UV irradiation indicated by yellow text. Yellow circles denote the irradiated region in each experiment. Arrowheads in A show MyoRLC-GFP clusters. Time is indicated as minutes:seconds at the top of each image. (Scale bars: 5 μm.) (B and E) Quantification of MyoRLC and DynIC dynamics (n ≥ 10 cells for each curve). Exclusion of MyoRLC from the irradiated region (B and E) and recruitment of DynIC to the irradiated region (E) are shown as ΔF/F, which is normalized background corrected mean fluorescence intensity (MFI). MyoRLC rearrangement was also assessed by calculating the MFI ratio between the back and the front of the T cell (B) (see also SI Materials and Methods). (C) Correlation between centrosome step size and differential accumulation of MyoRLC around the centrosome, calculated at each time point by subtracting the MyoRLC MFI in front of the centrosome from the MFI behind centrosome. Data are sorted based on the step size of the centrosome at the same time point (n = 10 cells; see also SI Materials and Methods). Error bars indicate SEM.
Fig. 4.
Fig. 4.
NMII and dynein asymmetry is regulated by nPKC activity downstream of DAG. (A and B) T cells (5C.C7) expressing either MyoRLC-GFP (A) or DynIC-GFP (B) were photoactivated and imaged in the presence of 5 ng/mL PMA or vehicle control. Quantification of NMII clearance and dynein recruitment are shown (n ≥ 8 cells per sample). (CE) T cells (5C.C7) derived from PKCθ−/− (θKO) mice were transduced with MyoRLC-GFP together with the indicated shRNAs and used for photoactivation experiments. (C) Validation of shRNA knockdown by immunoblot, with β actin serving as a loading control. NT, nontargeting shRNA control. (D) Representative time-lapse montages comparing MyoRLC distribution in θKO cells with or without PKCη and PKCε. The time of UV irradiation is indicated by yellow text, and the irradiated region is denoted by yellow circles. (Scale bars: 5 μm.) (E) Quantification of NMII clearance from the irradiated region in θKO cells with or without PKCη and PKCε (n ≥ 10 cells for each sample). MyoRLC and DynIC dynamics were quantified as in Fig. 3, with purple lines indicating UV irradiation. Error bars denote SEM.
Fig. 5.
Fig. 5.
Acute activation or inhibition of PKC activity induces NMII remodeling. T cells (5C.C7) expressing MyoRLC-RFP were imaged in TIRF and treated with 5 ng/mL PMA or 500 nM Gö6983 as indicated during time-lapse acquisition. (A) Representative time-lapse montages, with addition of reagents indicated by the red line. (Scale bars: 5 μm.) (BD) Clustering of MyoRLC at the membrane was quantified by calculation of the SD of the fluorescence signals for each cell (n = 10 cells for each curve; see also Materials and Methods). The time of reagent addition is indicated by the gap in each curve. Error bars denote SEM.
Fig. 6.
Fig. 6.
nPKC recruitment and MyoRLC phosphorylation is associated with NMII remodeling. (A and B) TCR-photoactivation experiments were performed using 5C.C7 T cells expressing either wild-type MyoRLC-GFP or MyoRLC(S1AS2A)-GFP. (A) Representative time-lapse montages, with the time of UV irradiation indicated by yellow text. Yellow circles denote the irradiated region. (B) Quantification of MyoRLC clearance from the irradiated region (n ≥ 10 cells for each sample). (CF) TCR-photoactivation experiments were performed using 5C.C7 T cells expressing MyoRLC-GFP together with either PKCη-RFP (C and D) or PKCθ-RFP (E and F). (C and E) Representative time-lapse montages, with the time of UV irradiation indicated by yellow text. Yellow circles denote the irradiated region. All probes were imaged in TIRF. (D and F) Quantification of MyoRLC clearance and nPKC recruitment at the irradiated region (n = 10 cells for each sample). Analysis was performed as in Fig. 3, with purple lines indicating UV irradiation. Error bars denote SEM. (All scale bars: 5 μm.)
Fig. 7.
Fig. 7.
ROCK is required for NMII clustering behind the centrosome. (A and B) T cells (5C.C7) expressing MyoRLC-RFP were imaged in TIRF and treated with 50 μM Y27632 and 500 nM Gö6983 as indicated during time-lapse acquisition. (A) Representative time-lapse montages, with addition of reagents indicated by the red line. (B) Quantification of MyoRLC clustering as described in Fig. 5 (n = 8 cells per curve). (C and D) Photoactivation experiments were performed using 5C.C7 T cells expressing either wild-type MyoRLC-GFP or MyoRLC(T18AS19A)-GFP. (C) Representative time-lapse montages, with the time of UV irradiation indicated by yellow text. Yellow circles denote the irradiated region. (D) MyoRLC asymmetry was quantified as described in Fig. 3 (n ≥ 10 cells per sample). (E and F) Centrosome polarization in the presence of 50 μM Y27632 or vehicle control was assessed as described in Fig. 2. (All scale bars: 5 μm.) Purple lines in graphs denote UV irradiation, and error bars indicate SEM. P values were calculated using Student t test. ***P < 0.001.

Similar articles

Cited by

References

    1. Bornens M. The centrosome in cells and organisms. Science. 2012;335(6067):422–426. - PubMed
    1. Huse M. (2012) Microtubule-organizing center polarity and the immunological synapse: Protein kinase C and beyond. Front Immunol 3:235. - PMC - PubMed
    1. Guy CS, Vignali DA. Organization of proximal signal initiation at the TCR:CD3 complex. Immunol Rev. 2009;232(1):7–21. - PMC - PubMed
    1. Quann EJ, Merino E, Furuta T, Huse M. Localized diacylglycerol drives the polarization of the microtubule-organizing center in T cells. Nat Immunol. 2009;10(6):627–635. - PubMed
    1. Quann EJ, Liu X, Altan-Bonnet G, Huse M. A cascade of protein kinase C isozymes promotes cytoskeletal polarization in T cells. Nat Immunol. 2011;12(7):647–654. - PMC - PubMed

Publication types

LinkOut - more resources