. 2013 Jul 16;110(29):11692-7.
doi: 10.1073/pnas.1222321110. Epub 2013 Jul 1.

Enhanced transcription rates in membrane-free protocells formed by coacervation of cell lysate

Affiliations

Enhanced transcription rates in membrane-free protocells formed by coacervation of cell lysate

Ekaterina Sokolova et al. Proc Natl Acad Sci U S A. .

Abstract

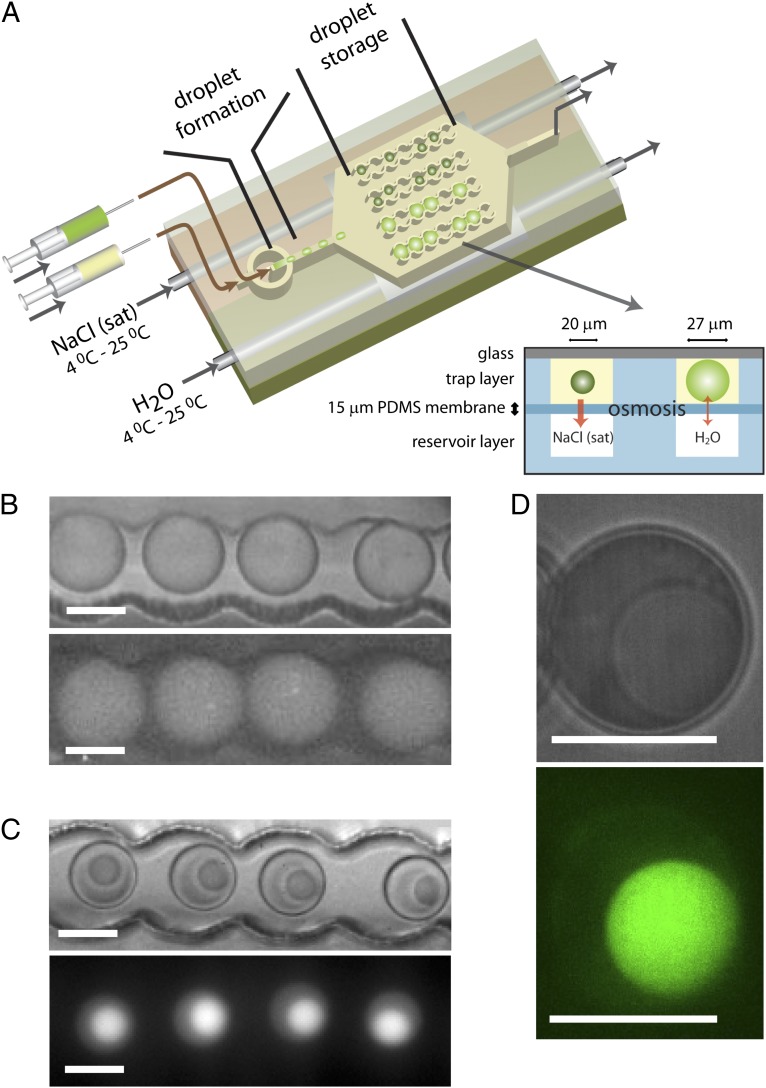
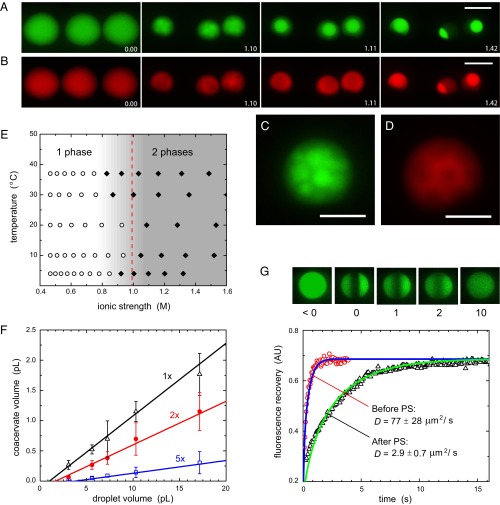
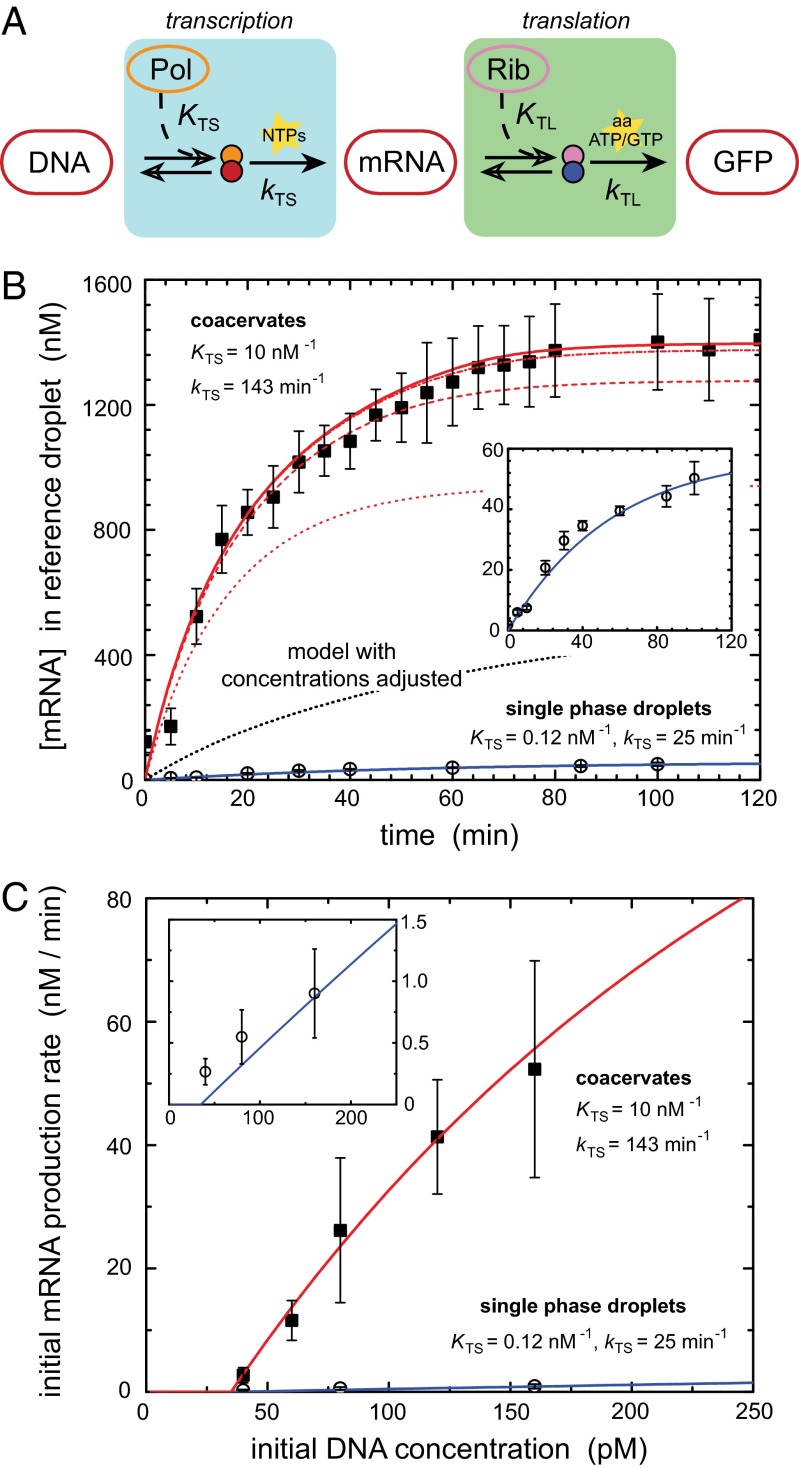
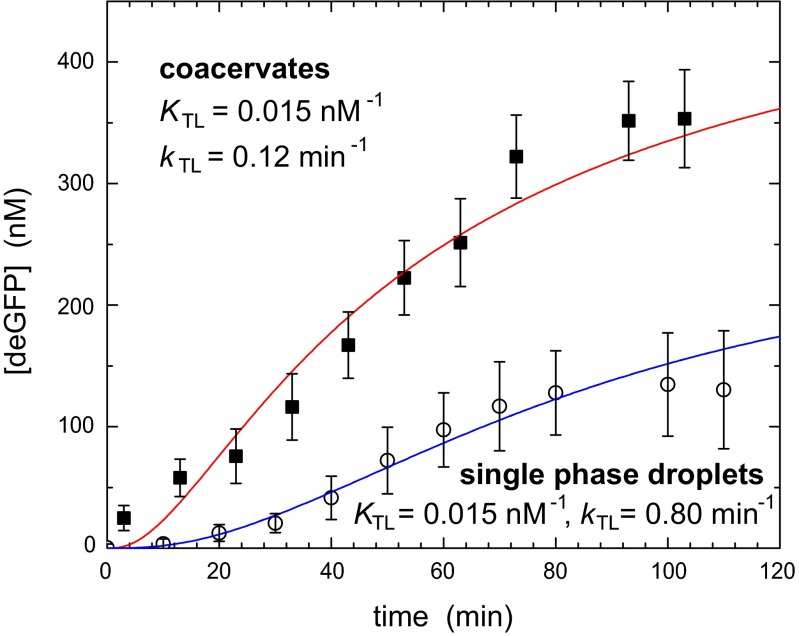
Liquid-liquid phase transitions in complex mixtures of proteins and other molecules produce crowded compartments supporting in vitro transcription and translation. We developed a method based on picoliter water-in-oil droplets to induce coacervation in Escherichia coli cell lysate and follow gene expression under crowded and noncrowded conditions. Coacervation creates an artificial cell-like environment in which the rate of mRNA production is increased significantly. Fits to the measured transcription rates show a two orders of magnitude larger binding constant between DNA and T7 RNA polymerase, and five to six times larger rate constant for transcription in crowded environments, strikingly similar to in vivo rates. The effect of crowding on interactions and kinetics of the fundamental machinery of gene expression has a direct impact on our understanding of biochemical networks in vivo. Moreover, our results show the intrinsic potential of cellular components to facilitate macromolecular organization into membrane-free compartments by phase separation.

Keywords: macromolecular crowding; microdroplets.


Conflict of interest statement

The authors declare no conflict of interest.

Figures

Fig. 1.
Fig. 1.
Phase separation in picoliter droplet by controlled osmotic shrinkage. (A) Schematic drawing of the microfluidic device in which two droplet populations with identical contents coexist: nonshrunk, homogeneous droplets, and shrunk, phase-separated droplets. (B and C) Optical microscopy images (Upper) and fluorescence images (Lower) of nonshrunk, homogeneous droplets (B) and shrunk, phase-separated droplets (C) in droplets traps. (D) Zoomed optical microscopy (Upper) and false-color confocal microscopy (Lower) image of a phase-separated droplet, showing that the coacervate is homogeneous on length scales down to the resolution of the microscope. (All scale bars: 20 μm.)
Fig. 2.
Fig. 2.
Coacervates are cell-like compartments. (A and B) Process of coacervation in shrinking droplets showing the concentrations of PEG (A) and DyLight 550-stained cell lysate (B) by false-color fluorescence microscopy. (Scale bars: 20 μm.) The labels indicate time (h:mm). (C and D) Zoomed images of the nucleation the coacervate for PEG (C) and cell lysate (D). (Scale bars: 10 μm.) (E) Phase diagram of cell-free expression kit in droplets as a function of ionic strength and temperature. The open symbols represent single-phase droplets, and the closed symbols represent phase-separated droplets. (F) The volume of the coacervate depends linearly on the volume of the original droplet and scales with the concentration of the cell-free expression kit. Different datasets correspond to different dilutions (1×, 2×, 5×) of the kit before droplet formation. The solid lines are linear fits of the data. (G) Fluorescence recovery of eGFP in single-phase droplets and coacervates after photobleaching. The solid lines are fits of the recovery curves to a 1D diffusion problem (see SI Text, S15 for details). Small images are false-color confocal microscopy images of coacervates, taken at times as indicated by the labels (in seconds).
Fig. 3.
Fig. 3.
Compartmentalization enhances transcription. (A) Schematic reaction pathway of transcription and translation, as used to model our data (see SI Text, S16 for details). (B) mRNA production in droplets and coacervates. The open symbols represent single-phase droplets, and the closed symbols represent coacervates. Inset shows a zoom-in of the production in single-phase droplets. To allow comparison between different DNA concentrations, all mRNA concentrations in the coacervates have been normalized to a reference droplet of 27 μm and coacervate of 13 μm. The lines are model predictions for equilibrium T7 RNA polymerase binding constants KTS and transcription rate constants kTS as indicated by the labels (see SI Text, S16 for details on other parameters). The single-phase droplet data are modeled with a binding constant KTS = 0.12 nM−1 and a transcription rate constant kTS = 25 min−1 (solid blue); the coacervate data are modeled with KTS = 0.12 (dotted), 1.0 (dashed), 10 (dash-dot), and 100 (solid red) nM−1 and kTS = 143 min−1. The black dotted line shows the predicted mRNA production for the case in which all macromolecular concentrations are increased to their actual value in the coacervates (SI Text, S10), but all binding constants and rate constants are unchanged with respect to single-phase droplets. (C) Data (symbols) and model predictions (lines) of the initial rate of mRNA production in droplets and coacervates as a function of the initial plasmid DNA concentration (see Fig. S6 for corresponding mRNA production curves). We assume that a small amount of DNA (0.095 µm−2, corresponding to 35 pM in a droplet of 27 µm) is adsorbed to the oil–water interface (SI Text, S14 and Fig. S4).
Fig. 4.
Fig. 4.
Protein expression in coacervates. deGFP production in droplets and coacervates. The open symbols represent single-phase droplets, and the closed symbols represent coacervates. The solid lines are model predictions for equilibrium ribosome binding constants and translation rate constants as indicated by the labels (see SI Text, S16 for details on other parameters). The coacervate data are modeled with the actual concentrations of all macromolecular components and enhanced transcription binding and rate constants KTS = 10 nM−1 and kTS = 143 min−1, respectively (Fig. 3B), compared with the single-phase droplets.

References

    1. Rasmussen S, et al. Evolution. Transitions from nonliving to living matter. Science. 2004;303(5660):963–965. - PubMed
    1. Rasmussen S, Chen LH, Nilsson M, Abe S. Bridging nonliving and living matter. Artif Life. 2003;9(3):269–316. - PubMed
    1. Noireaux V, Libchaber A. A vesicle bioreactor as a step toward an artificial cell assembly. Proc Natl Acad Sci USA. 2004;101(51):17669–17674. - PMC - PubMed
    1. Szostak JW, Bartel DP, Luisi PL. Synthesizing life. Nature. 2001;409(6818):387–390. - PubMed
    1. Hyman AA, Simons K. Cell biology. Beyond oil and water—phase transitions in cells. Science. 2012;337(6098):1047–1049. - PubMed

Publication types

MeSH terms

Substances