. 2013;9(6):e1003415.
doi: 10.1371/journal.ppat.1003415. Epub 2013 Jun 20.

Adhesins and host serum factors drive Yop translocation by yersinia into professional phagocytes during animal infection

Affiliations

Adhesins and host serum factors drive Yop translocation by yersinia into professional phagocytes during animal infection

Francisco J Maldonado-Arocho et al. PLoS Pathog. 2013.

Abstract

Yersinia delivers Yops into numerous types of cultured cells, but predominantly into professional phagocytes and B cells during animal infection. The basis for this cellular tropism during animal infection is not understood. This work demonstrates that efficient and specific Yop translocation into phagocytes by Yersinia pseudotuberculosis (Yptb) is a multi-factorial process requiring several adhesins and host complement. When WT Yptb or a multiple adhesin mutant strain, ΔailΔinvΔyadA, colonized tissues to comparable levels, ΔailΔinvΔyadA translocated Yops into significantly fewer cells, demonstrating that these adhesins are critical for translocation into high numbers of cells. However, phagocytes were still selectively targeted for translocation, indicating that other bacterial and/or host factors contribute to this function. Complement depletion showed that complement-restricted infection by ΔailΔinvΔyadA but not WT, indicating that adhesins disarm complement in mice either by prevention of opsonophagocytosis or by suppressing production of pro-inflammatory cytokines. Furthermore, in the absence of the three adhesins and complement, the spectrum of cells targeted for translocation was significantly altered, indicating that Yersinia adhesins and complement direct Yop translocation into neutrophils during animal infection. In summary, these findings demonstrate that in infected tissues, Yersinia uses adhesins both to disarm complement-dependent killing and to efficiently translocate Yops into phagocytes.


Conflict of interest statement

The authors have declared that no competing interests exist.

Figures
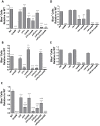
Figure 1
Figure 1. ΔailΔinvΔyadA strains are defective for Yop translocation into isolated splenocytes.
Splenocytes were infected with the indicated ETEM-expressing strains (A–C) at an MOI of 1∶1 for (A) 1 h with IP2666 strains, (B) 45 min with IP32953 strains or (C) 45 min with YPIII strains, or (D–E) with the indicated IP2666 strains for (D) 4 h at an MOI of 1∶1 or (E) 1 h at an MOI of 20∶1. (A–E) CCF4 conversion from green to blue was measured by flow cytometry and the relative percentage of Blue+ cells was determined by setting WT to 1 and normalizing the percentage of Blue+ cells of the adhesin mutants to WT. Experiments were repeated 3–8 times (A–E: *P<0.05, **P<0.01 and ***P<0.001 compared to WT; and A–C: +P<0.05, ++P<0.01 and +++P<0.001 compared to ΔyopB).
Figure 2
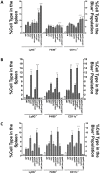
Figure 2. Adhesin mutants have variable, strain dependent effects on translocation into professional phagocytes.
Splenocytes were infected with the indicated ETEM-expressing strains at an MOI of 1∶1 for (A) 1 h with IP2666, (B) 45 min with IP32953 strains or (C) 45 min with YPIII strains. Professional phagocytes were distinguished by cell-type surface marker staining using flow cytometry. The left Y-axis represents the percentage of each cell type in the spleen (white bars) while the right Y-axis represents the percentage of each cell type present in the Blue+ population (grey bars). Experiment was repeated 3–8 times (ND, not determined; *P<0.05, **P<0.01 and ***P<0.001 compared to WT).
Figure 3
Figure 3. ΔyadA mutants associate more frequently with B and T cells than WT.
(A–C) Splenocytes were infected at an MOI of 0.5∶1 with the indicated IP2666 GFP-expressing strains and cell types were distinguished by cell-type surface marker staining using flow cytometry. (A) The percentage of cells bound to GFP+ bacteria was determined by fluorescence intensity in the FITC channel of the total live splenocyte population. (B and C) The percentage of B and T cells (B) and phagocytes (C) bound by GFP+ bacteria. Experiment was repeated 5–8 times (*P<0.05, **P<0.01 and ***P<0.001 compared to WT).
Figure 4
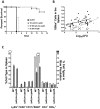
Figure 4. ΔailΔinvΔyadA is reduced in virulence and for Yop translocation during animal infections.
Mice were infected IV with 800 CFU of IP2666 WT-ETEM (1X-WT) or ΔailΔinvΔyadA-ETEM (1X-ΔailΔinvΔyadA), or 30,000 CFU of ΔailΔinvΔyadA-ETEM (37.5XΔailΔinvΔyadA) or ΔyopB-ETEM (37.5X-ΔyopB). (A) Animals were monitored for morbidity and mortality for a period of 15 days post infection and survival was plotted. (B–C) Four days post-infection, spleens were isolated and single cell suspensions were generated to enumerate CFU and percentage of Blue+ cells from mice infected with 800 CFU of WT-ETEM and 30,000 CFU of ΔailΔinvΔyadA-ETEM. (B) Black-filled squares with a solid black line represent values from mice infected with WT-ETEM and grey-filled diamonds with a dashed grey line represent values from mice infected with ΔailΔinvΔyadA-ETEM. Linear regression analysis determined that the percentage of Blue+ cells is significantly higher in animals infected with WT-ETEM than with ΔailΔinvΔyadA-ETEM (P = 0.0001). (C) The percentage of each cell type in the organ (white bars) compared with the percentage of each cell type present in the Blue+ population (grey bars) from spleens infected with WT-ETEM or ΔailΔinvΔyadA-ETEM. Only mice with greater than 4.8×10⁴ CFU were analyzed (***P<0.001).
Figure 5
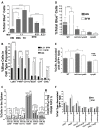
Figure 5. Serum directs Yop translocation into professional phagocytes.
(A–C) Splenocytes in 5% HIS, Fn (40 µg/ml), BSA (5 mg/ml) or SFM were infected for 1 h with IP2666 WT-ETEM at an MOI of 0.2∶1, 0.5∶1 or 1∶1 and the percentage of Blue+ cells was determined by FACS. (B–C) Splenocytes infected for 1 h with IP2666 WT-ETEM at an MOI of 0.2∶1 or 1∶1 in SFM or an MOI of 1∶1 in HIS were analyzed for (B) the percentage of Blue+ cells in each cell type population or (C) the percentage of each cell type in the Blue+ population (gray bars) compared to the percentage of each cell type in the spleen (white bars). (D) Splenocytes were infected for 1 h at an MOI of 1∶1 with IP2666 WT-ETEM, ΔailΔinvΔyadA-ETEM or ΔyopB-ETEM and the percentage of Blue+ cells was determined. (E–F) Splenocytes were infected with the indicated IP2666 GFP+ strains at an MOI of 0.5∶1 and (E) the percentage of cells bound to GFP+ bacteria determined by fluorescence intensity in the FITC channel of the total splenocyte population, or (F) the percentage of specific cell types bound by GFP+ Yptb. Experiment was repeated 5–8 times (*P<0.05, **P<0.01 and ***P<0.001).
Figure 6
Figure 6. Complement depletion restores virulence and translocation of Yops by the ΔailΔinvΔyadA mutant.
CVF-treated mice were infected IV with 800 CFU of IP2666 WT-ETEM (1X-WT), 800 CFU of ΔailΔinvΔyadA-ETEM (1X-ΔailΔinvΔyadA), or 30,000 CFU of ΔailΔinvΔyadA-ETEM (37.5X-ΔailΔinvΔyadA). (A) Animals were monitored for morbidity and mortality for a period of 15 days post infection and survival was plotted. (B–D) Four days post-infection, spleens were isolated to determine CFUs (B) and the percentage of Blue+ cells present in the organ compared to the log10CFU (C). (B–C) Each symbol represents data from one mouse; the bar in (B) represents the geometric mean. (C) The black line represents values from mice infected with 800 CFU WT-ETEM as shown in Fig. 4B, open-grey squares with grey line represents CVF-treated mice infected with 800 CFU WT-ETEM and open-grey triangles with dashed grey dotted line represent values from 800 CFU ΔailΔinvΔyadA-ETEM. Linear regression analysis determined that the percentage of Blue+ cells is the same in both WT infections regardless of CVF. In contrast, the CVF+1X-ΔailΔinvΔyadA injected Yops into significantly more cells than 1X-WT and CVF+1X-WT (with P<0.0001 for both). (D) The distribution of cell types found in the organ (white bars, left y-axis) versus the distribution of cell types found in the Blue+ population (gray bars, right y-axis) for each infection condition was compared. (B and D) (**P<0.01 and ***P<0.001). Data from mice infected with 800 CFU of WT-ETEM and 30,000 CFU of ΔailΔinvΔyadA in panels B–D are from the same mice analyzed in Fig. 4B–C.
Figure 7
Figure 7. A model of factors that drive Yop translocation during mouse infection.
(A) During infection, Yptb expresses adhesins Ail, Invasin and YadA, which mediate binding to host-cell receptors directly or indirectly via ECM components or complement, leading to TTSS engagement and Yop delivery into host cells. (B) In a ΔailΔinvΔyadA mutant, another unknown Yptb adhesin becomes accessible and mediates Yop delivery. Factors such as complement dampen proper engagement of the unknown adhesin with host cells leading to fewer Yop translocated cells. (C) In the absence of complement, an unknown adhesin becomes accessible in the ΔailΔinvΔyadA mutant and mediates TTSS engagement and Yop delivery into host cells.

References

    1. Mota LJ, Cornelis GR (2005) The bacterial injection kit: type III secretion systems. Ann Med 37: 234–249. - PubMed
    1. Marketon MM, DePaolo RW, DeBord KL, Jabri B, Schneewind O (2005) Plague bacteria target immune cells during infection. Science 309: 1739–1741. - PMC - PubMed
    1. Durand EA, Maldonado-Arocho FJ, Castillo C, Walsh RL, Mecsas J (2010) The presence of professional phagocytes dictates the number of host cells targeted for Yop translocation during infection. Cell Microbiol 12: 1064–1082. - PMC - PubMed
    1. Köberle M, Klein-Günther A, Schütz M, Fritz M, Berchtold S, et al. (2009) Yersinia enterocolitica targets cells of the innate and adaptive immune system by injection of Yops in a mouse infection model. PLoS Pathog 5: e1000551. - PMC - PubMed
    1. Grosdent N, Maridonneau-Parini I, Sory MP, Cornelis GR (2002) Role of Yops and adhesins in resistance of Yersinia enterocolitica to phagocytosis. Infect Immun 70: 4165–4176. - PMC - PubMed

Publication types

MeSH terms

Substances

LinkOut - more resources