. 2013 Jun 27:7:26.
doi: 10.3389/fnsys.2013.00026. Print 2013.

Visual encoding and fixation target selection in free viewing: presaccadic brain potentials

Affiliations

Visual encoding and fixation target selection in free viewing: presaccadic brain potentials

Andrey R Nikolaev et al. Front Syst Neurosci. .

Abstract

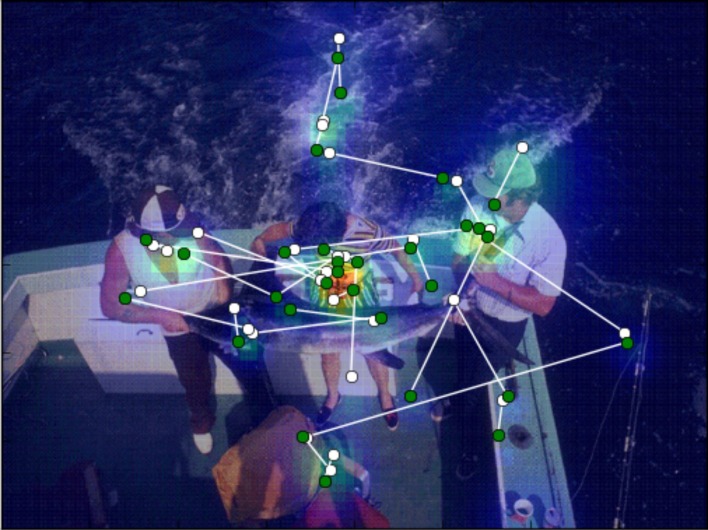
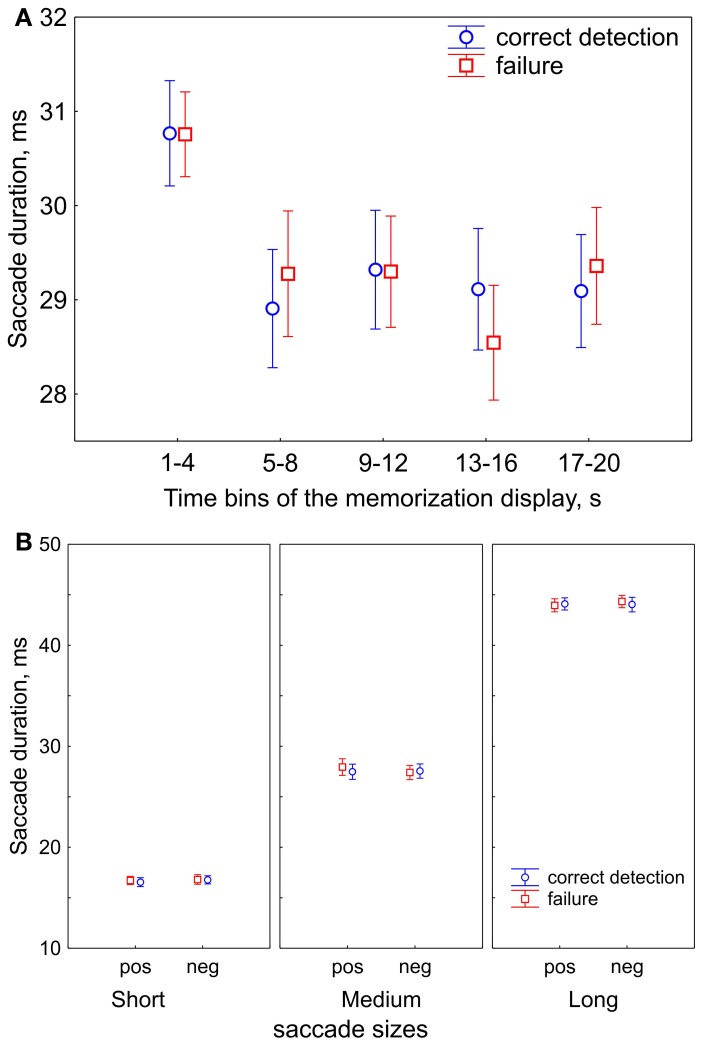
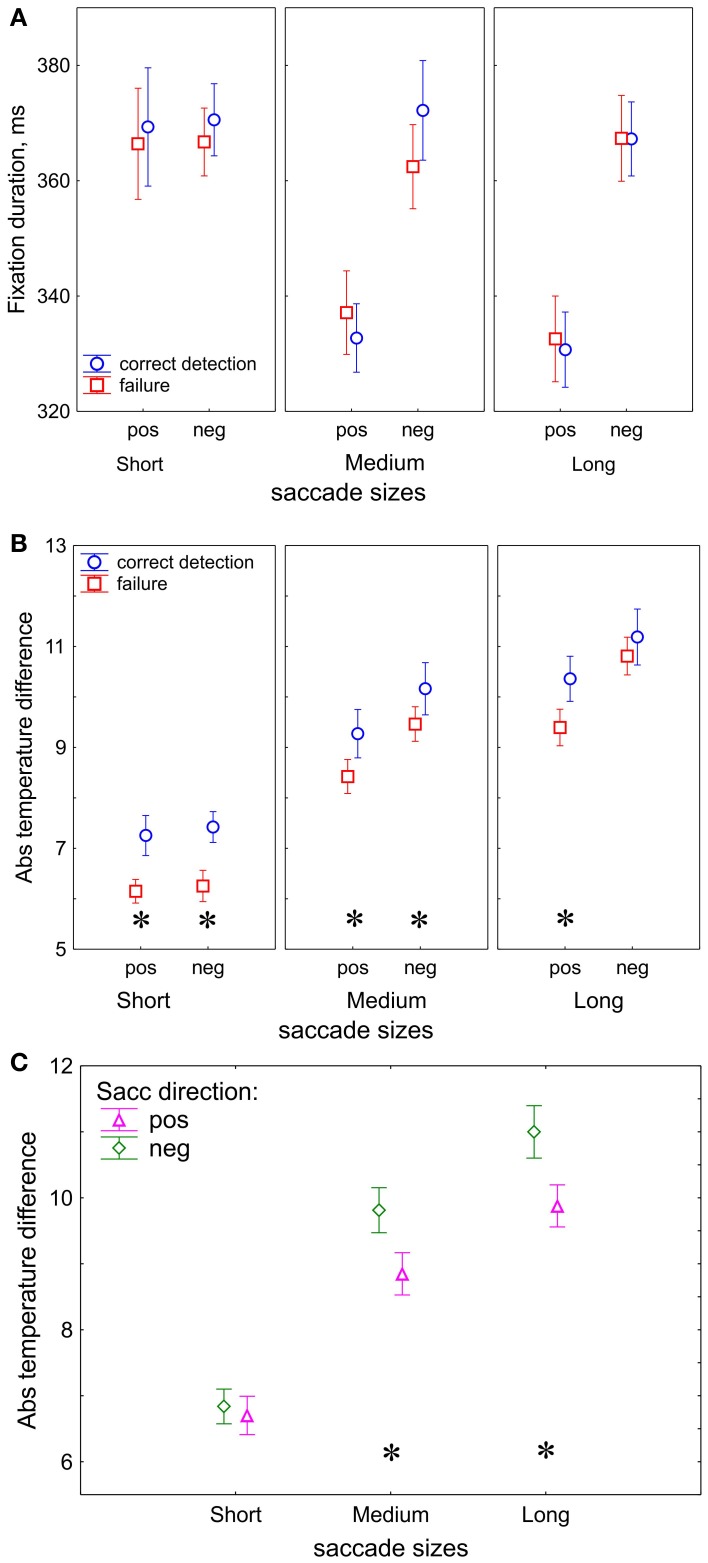
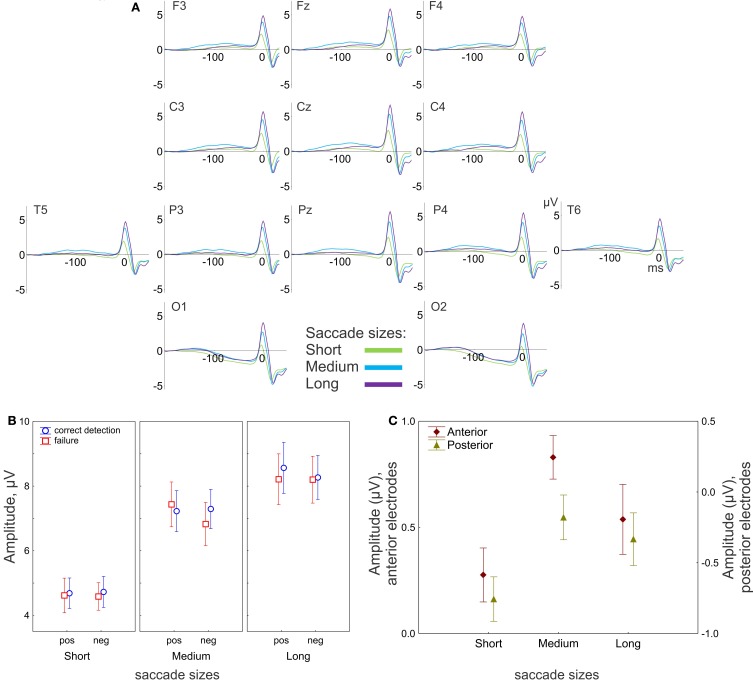
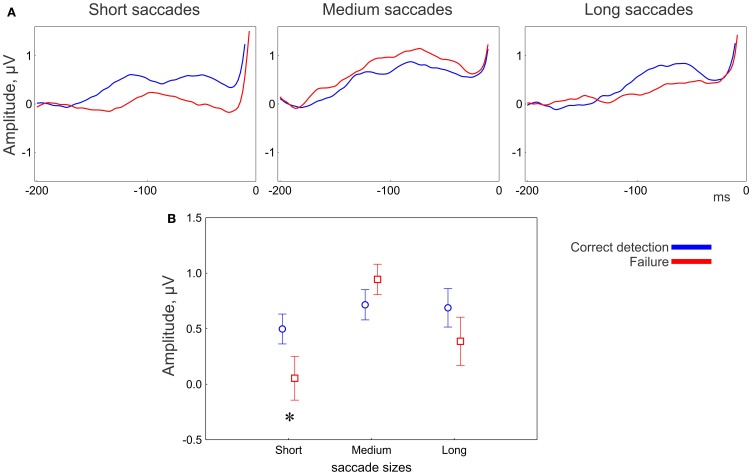
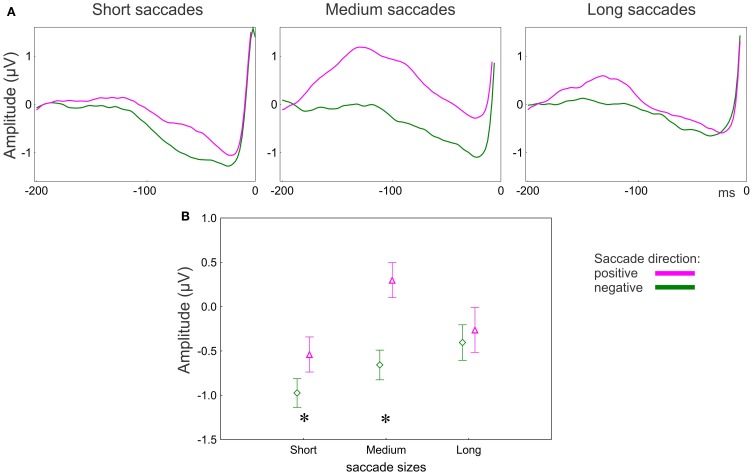
In scrutinizing a scene, the eyes alternate between fixations and saccades. During a fixation, two component processes can be distinguished: visual encoding and selection of the next fixation target. We aimed to distinguish the neural correlates of these processes in the electrical brain activity prior to a saccade onset. Participants viewed color photographs of natural scenes, in preparation for a change detection task. Then, for each participant and each scene we computed an image heat map, with temperature representing the duration and density of fixations. The temperature difference between the start and end points of saccades was taken as a measure of the expected task-relevance of the information concentrated in specific regions of a scene. Visual encoding was evaluated according to whether subsequent change was correctly detected. Saccades with larger temperature difference were more likely to be followed by correct detection than ones with smaller temperature differences. The amplitude of presaccadic activity over anterior brain areas was larger for correct detection than for detection failure. This difference was observed for short "scrutinizing" but not for long "explorative" saccades, suggesting that presaccadic activity reflects top-down saccade guidance. Thus, successful encoding requires local scanning of scene regions which are expected to be task-relevant. Next, we evaluated fixation target selection. Saccades "moving up" in temperature were preceded by presaccadic activity of higher amplitude than those "moving down". This finding suggests that presaccadic activity reflects attention deployed to the following fixation location. Our findings illustrate how presaccadic activity can elucidate concurrent brain processes related to the immediate goal of planning the next saccade and the larger-scale goal of constructing a robust representation of the visual scene.

Keywords: EEG; attention; change detection; heat maps; presaccadic interval; saccade guidance; saccades; visual encoding.


Figures

Figure 1
Figure 1
Temperature map computed as a function of fixation duration and fixation density. The saccades are superimposed on the image. Green circles designate the starting points of saccades and white circles designate the end points. The direction of the saccade is given a positive or negative sign, depending on the difference between the temperature values of start and end points: positive if the end temperature is higher than the start, negative if vice versa.
Figure 2
Figure 2
Saccade durations (sizes). (A) Saccade durations in the course of free viewing during 20-s presentations of the memorization display for subsequent correct detection and failure. The 20-s presentation of the memorization display was divided in five 4-s time bins. Saccade durations decrease after the first bin. (B) The ranges of saccade durations after division in 3 saccade size bins: short, medium, and long saccades. Saccade sizes are shown for positive (“pos”) and negative (“neg”) saccade directions, and for correct detection and failure, in order to demonstrate that their values did not differ between conditions. The data points are the means and the error bars represent standard errors across 17 participants.
Figure 3
Figure 3
Eye movement results. (A) Duration of the fixations preceding the saccades used for dividing trials into saccade size bins. (B) Absolute temperature difference on the fixation heat maps, correctness effect. (C) Absolute temperature difference, saccade direction effect. “pos” indicates positive and “neg” indicates negative saccade direction. The data points are the means and the error bars represent standard errors across 17 participants. The asterisks designate significant differences between correct detection and failure.
Figure 4
Figure 4
EEG results: effect of saccade size. (A) Grand-averaged potentials for 13 electrodes for three saccade sizes. 0 ms is the saccade onset. (B) The peak-to-peak amplitude of the saccadic spike potential. The amplitude gradually increases with saccade size. (C) Amplitude of the presaccadic activity (the mean in the interval −100 to 20 ms prior to the saccade), effect of saccade size for anterior (F3, F4, Fz, C3, C4) and posterior (P3, P4, Pz, O1, O2) electrode group. “pos” indicates positive and “neg” indicates negative saccade direction. The data points are the means and the error bars represent standard errors across 17 participants.
Figure 5
Figure 5
EEG results: effect of correctness for the anterior group of electrodes. (A) Grand averaged potentials for three saccade sizes. 0 ms is saccade onset. (B) Amplitude of the presaccadic activity (the mean in the interval −100 to 20 ms prior to the saccade) for correctness conditions for 3 saccade sizes. The asterisk designates a significant difference between correct detection and failure. The data points are the means and the error bars are the standard errors across 17 participants.
Figure 6
Figure 6
EEG results: effect of saccade direction for posterior group of electrodes. (A) Grand averaged potentials for three saccade sizes for the posterior group of electrodes. 0 ms is saccade onset. (B) Amplitude of the presaccadic activity (the mean in the interval −100 to 20 ms prior to the saccade) for 3 saccade sizes. Asterisks designate significant differences between negative and positive saccade directions. The data points are the means and the error bars represent standard errors across 17 participants.
Figure A1
Figure A1
The effect of reference on the polarity of the saccadic spike potentials. Grand-averaged potentials (17 participants, averaged across all conditions) for 13 electrodes relative to the linked mastoid (“LinkMast” used in the paper, the left Y axis) and the average reference (“AvrRef”, the right Y axis). 0 ms is the saccade onset. The average reference inverts the polarity of the saccadic spike potentials over the frontal sites.

Similar articles

Cited by

References

    1. Andersen R. A., Asanuma C., Cowan W. M. (1985). Callosal and prefrontal associational projecting cell populations in area 7A of the macaque monkey: a study using retrogradely transported fluorescent dyes. J. Comp. Neurol. 232, 443–455 10.1002/cne.902320403 - DOI - PubMed
    1. Awh E., Armstrong K. M., Moore T. (2006). Visual and oculomotor selection: links, causes and implications for spatial attention. Trends Cogn. Sci. 10, 124–130 10.1016/j.tics.2006.01.001 - DOI - PubMed
    1. Becker W. (1991). Saccades, in Vision and Visual Dysfunction, ed Carpenter R. H. S. (Boca Raton, FL: CRC Press; ), 95–137
    1. Becker W., Hoehne O., Iwase K., Kornhuber H. H. (1973). Cerebral and ocular muscle potentials preceding voluntary eye movements in man. Electroencephalogr. Clin. Neurophysiol. Suppl. 33, 99–104 - PubMed
    1. Bullier J., Schall J. D., Morel A. (1996). Functional streams in occipito-frontal connections in the monkey. Behav. Brain. Res. 76, 89–97 10.1016/0166-4328(95)00182-4 - DOI - PubMed

LinkOut - more resources