

Health effects of coastal storms and flooding in urban areas: a review and vulnerability assessment
- PMID: 23818911
- PMCID: PMC3683478
- DOI: 10.1155/2013/913064
Health effects of coastal storms and flooding in urban areas: a review and vulnerability assessment
Abstract
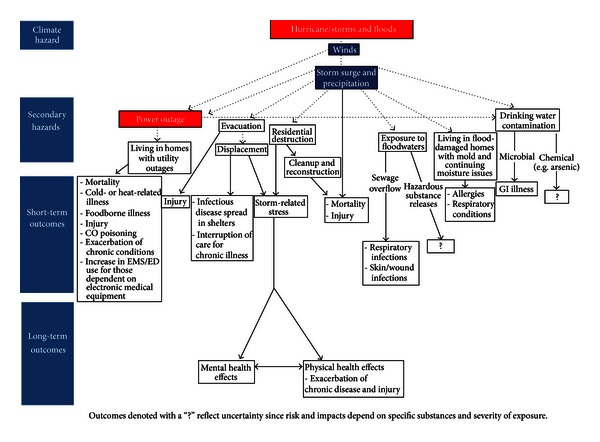
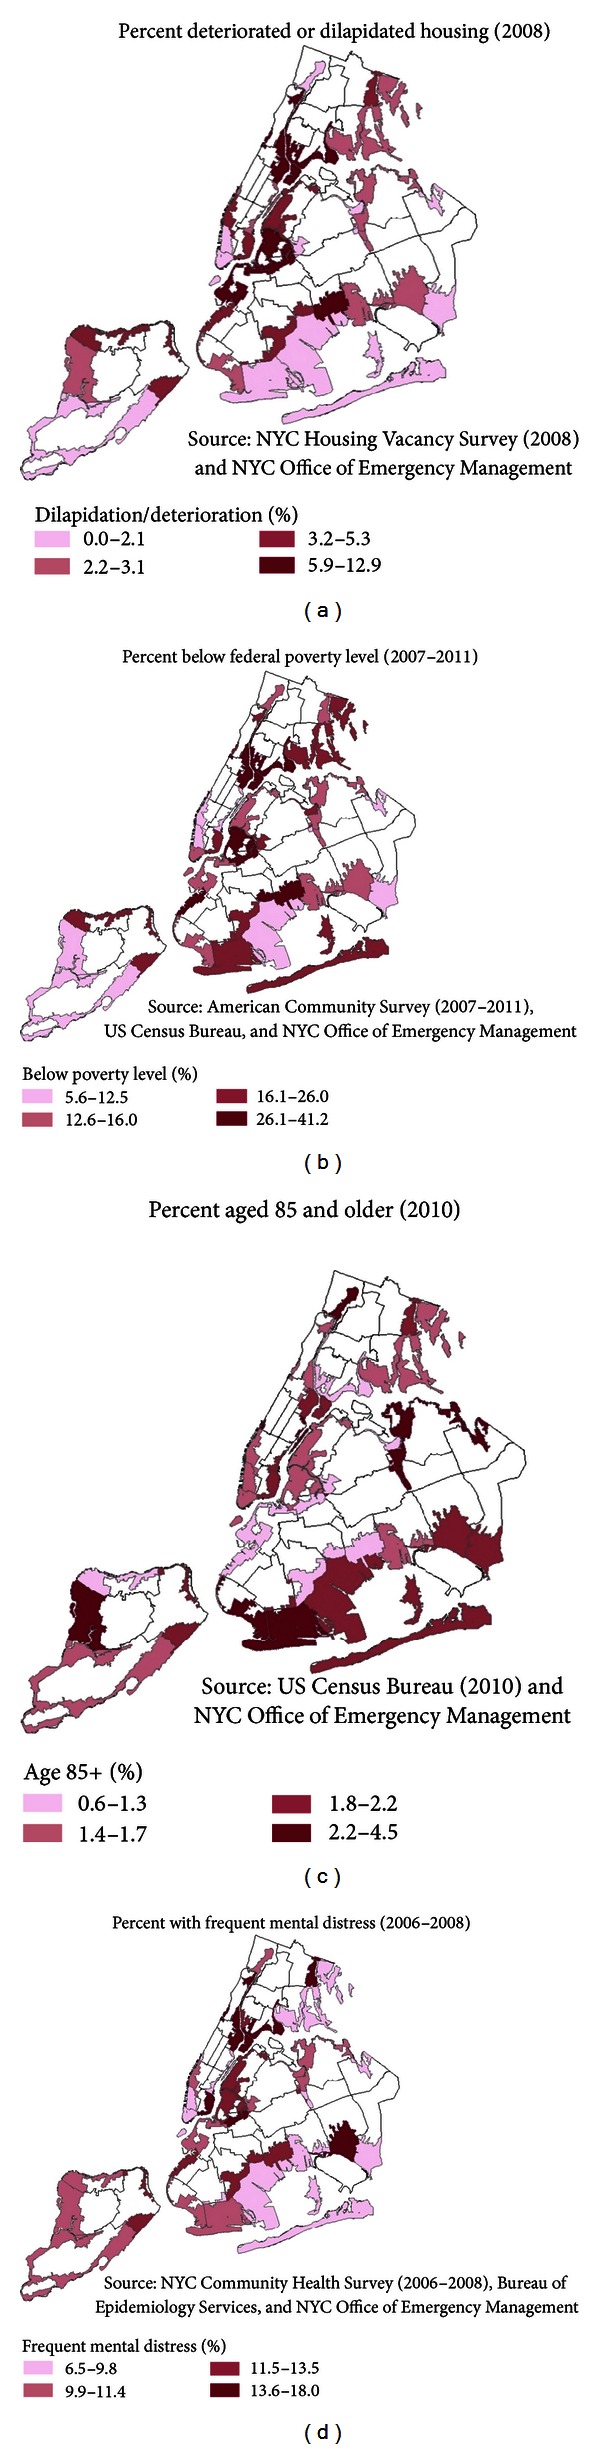
Coastal storms can take a devastating toll on the public's health. Urban areas like New York City (NYC) may be particularly at risk, given their dense population, reliance on transportation, energy infrastructure that is vulnerable to flood damage, and high-rise residential housing, which may be hard-hit by power and utility outages. Climate change will exacerbate these risks in the coming decades. Sea levels are rising due to global warming, which will intensify storm surge. These projections make preparing for the health impacts of storms even more important. We conducted a broad review of the health impacts of US coastal storms to inform climate adaptation planning efforts, with a focus on outcomes relevant to NYC and urban coastal areas, and incorporated some lessons learned from recent experience with Superstorm Sandy. Based on the literature, indicators of health vulnerability were selected and mapped within NYC neighborhoods. Preparing for the broad range of anticipated effects of coastal storms and floods may help reduce the public health burden from these events.
Figures
References
-
- NPCC. New York City Panel on Climate Change: Climate Risk Information. New York, NY, USA: 2010. - PubMed
-
- NYC. Update on Recovery and Assistance Operations. 2012. http://www.nyc.gov/
-
- NOAA. State of the Coast 2013, http://stateofthecoast.noaa.gov/population/welcome.html.
-
- NCADAC. Draft Third National Climate Assessment 2013. U.S. Global Change Research Program.
Publication types
MeSH terms
Grants and funding
LinkOut - more resources
Full Text Sources
Other Literature Sources
Medical
