. 2013 Sep 13;113(7):891-901.
doi: 10.1161/CIRCRESAHA.113.301319. Epub 2013 Jul 2.

Uncoupling protein 2 impacts endothelial phenotype via p53-mediated control of mitochondrial dynamics

Affiliations

Uncoupling protein 2 impacts endothelial phenotype via p53-mediated control of mitochondrial dynamics

Yukio Shimasaki et al. Circ Res. .

Abstract

Rationale: Mitochondria, although required for cellular ATP production, are also known to have other important functions that may include modulating cellular responses to environmental stimuli. However, the mechanisms whereby mitochondria impact cellular phenotype are not yet clear.

Objective: To determine how mitochondria impact endothelial cell function.

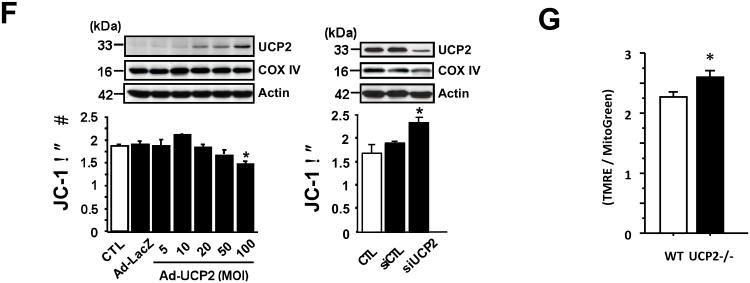
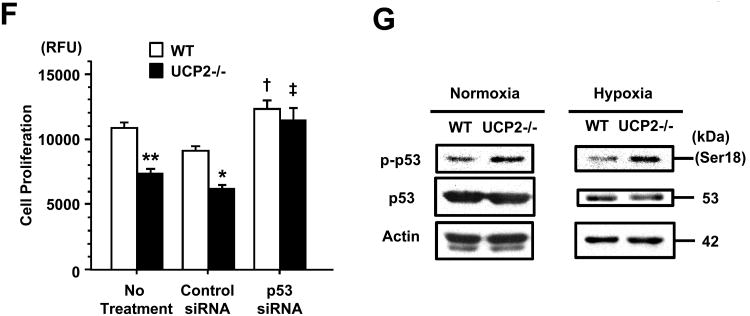
Methods and results: We report here that stimuli for endothelial cell proliferation evoke strong upregulation of mitochondrial uncoupling protein 2 (UCP2). Analysis in silico indicated increased UCP2 expression is common in highly proliferative cell types, including cancer cells. Upregulation of UCP2 was critical for controlling mitochondrial membrane potential (Δψ) and superoxide production. In the absence of UCP2, endothelial growth stimulation provoked mitochondrial network fragmentation and premature senescence via a mechanism involving superoxide-mediated p53 activation. Mitochondrial network fragmentation was both necessary and sufficient for the impact of UCP2 on endothelial cell phenotype.

Conclusions: These data identify a novel mechanism whereby mitochondria preserve normal network integrity and impact cell phenotype via dynamic regulation of UCP2.

Keywords: angiogenesis; endothelial function; endothelium; ischemia; mitochondria; mitochondrial uncoupling proteins; superoxides.


Conflict of interest statement

Disclosures: None

Figures

Figure 1
Figure 1. Regulation of endothelial UCP2 and Δψ with proliferation
BAECs were (A) stimulated with FBS or (B) cultured to specific confluence before assessment of Δψ by JC-1 fluorescence and expression of UCP2, UCP3, cytochrome c oxidase IV (COXIV), or actin by immunoblot. 5 μM Carbonyl cyanide m-chlorophenyl hydrazone (CCCP) was used as a control for the lower limit of Δψ. Data represent n = 3; *P < 0.05 for trend from one-way ANOVA. (C) Mitochondrial Δψ by tetramethylrhodamine ethyl ester (TMRE) corrected for mitochondrial mass. N=3; *P < 0.05 for trend from one-way ANOVA (D) Expression of UCP2 and UCP3 mRNA and protein in BAECs. (E) Densitometric analysis of UCP2 protein by immunoblot as a function of confluence. N=5; *P < 0.05 vs. 50% by ANOVA with Tukey-Kramer post-hoc test. (F) BAECs (CTL) were transfected with UCP2 (Ad-UCP2 at the indicated MOI), β-galactosidase (Ad-LacZ; 100 MOI), or the indicated siRNA followed by assessment for Δψ or protein levels of transfected or endogenous UCP2, cytochrome c oxidase IV (COX IV), or actin by immunoblotting. N = 3, *P < 0.05 vs. LacZ adenovirus or siCTL. (G) Mitochondrial Δψ by TMRE as in (C). N=3; *P < 0.05 by unpaired t-test.
Figure 2
Figure 2. Metabolic signature of UCP2-null endothelium
(A) Oxygen consumption was determined in wild-type and UCP2-null MLECs in the presence or absence of oligomycin (oligo) or carbonyl cyanide 4-(trifluoromethoxy)phenylhydrazone (FCCP) using a Clark electrode as described in “Methods.” (B) Media from wild-type or UCP2-null MLECs in 0.1% serum was analyzed for lactate content and expressed as a function of cell count. N=3; *P<0.01 vs. WT by unpaired t-test. (C) BAEC ATP levels as a function of UCP2 status as described in “Methods.” N=3; *P<0.01 vs. siCTL by unpaired t-test. (D) BAEC ATP levels as a function of confluence or oligomycin treatment. N=4; *P<0.01 for trend by oneway ANOVA.
Figure 3
Figure 3. UCP2 modulates endothelial cell proliferation and migration
(A) Wild-type MLECs were treated with AICAR (0.5 mM) or VEGF (25 ng/mL) as indicated for 24h followed by immunoblots for the indicated proteins. Actin, cytochrome c (Cyt c) and cytochrome c oxidase subunit IV (COX IV) were loading controls for cytosol and mitochondria. (B) BAEC proliferation by [3H]-thymidine incorporation in response to VEGF or UCP2 manipulation as indicated. Data are normalized to the VEGF vehicle control. N=4-5; *P < 0.05 vs. respective controls by Mann-Whitney U test. (C) BAECs underwent UCP2 manipulation as indicated and migration assessed 20h after scratch N=3-5; *P < 0.01 vs. respective control by Mann-Whitney U test. (D) Proliferation of wild-type (WT) and UCP2-/- MLECs by cell count. N=4; *P < 0.05 vs. WT by two-way repeated measures ANOVA. (E) Migration of WT and UCP2-/- MLECs after scratch wounding. N=5; *P < 0.01 vs. WT by Mann-Whitney U test. (F) Aortic segments from the indicated genotypes implanted in collagen gel after 7d (bar = 500 um) with capillary sprout counts as a function of time. N=6; *P < 0.001 vs. WT by two-way repeated-measures ANOVA. (G) Capillary sprouting in UCP2-/- aortic segments in collagen gel containing no additions (CTL) or the indicated adenoviral vector. N=6/group; *P < 0.01 vs. vehicle or Ad-LacZ by two-way repeated measures ANOVA. (H) Blood flow recovery in wild-type (WT) and UCP2-/- mice with unilateral femoral artery excision expressed as a fraction ratio of the ischemic (I) vs. non-ischemic (N) limbs with representative images of laser-Doppler tissue perfusion in hindlimbs. N=4; *P = 0.02 vs. WT by two-way repeated measures ANOVA.
Figure 4
Figure 4. UCP2 dictates endothelial phenotype via mitochondrial •O2-
(A) BAECs stained with mitochondrial-targeted hydroethidine at the indicated level of confluence to assess mitochondrial •O2- (bar = 50 μm). (B) Mitochondrial •O2- in MLECs from the indicated genotype as a function of confluence. N=4; *P < 0.01 for WT vs. UCP2-/- by two-way factorial ANOVA. (C) MLEC mitochondrial •O2- in the indicated genotypes transfected with UCP2 (Ad-UCP2), SOD2 (Ad-SOD2), or LacZ. N=3; *P < 0.05 vs. UCP2-/- Ad-LacZ; †P < 0.05 vs. wild-type Ad-LacZ. (D) Proliferation of UCP2-null MLECs transfected as in (C) with data normalized to CTL. N=3; *P < 0.05 vs. Ad-LacZ by Kruskal-Wallis ANOVA. (E) Mitochondrial •O2- in wild-type vs. SOD2+/- endothelium. N=4 – 8; *P<0.05 vs. WT by Mann-Whitney U test. (F) Proliferation of wild-type and SOD2+/- MLECs as a function of time. N=4; *P < 0.05 for trend by two-way repeated measures ANOVA. Mitochondrial •O2- (G) and proliferation (H) in SOD2+/-MLECs as a function of transfection with control (LacZ), UCP2, or SOD2 adenovirus. N=3; *P < 0.05 vs. LacZ by Kruskal-Wallis ANOVA. (I) Left, Migration of BAECs with manipulated SOD2 levels via the indicated adenovirus or siRNA. N=6; *P = 0.01 vs. respective controls by Mann-Whitney U test. Right, BAEC Mitochondrial •O2- as a function of treatment with CTL or SOD2 siRNA. N=3; *P < 0.01 vs. control siRNA by Student's t-test. (J) Capillary sprouting in aortic segments from the indicated genotypes. N=6; *P < 0.001 vs. WT by two-way repeated measures ANOVA. (K) Blood flow recovery in WT and SOD2+/- mice after unilateral hindlimb ischemia with our without hindlimb transfection with UCP2 or LacZ adenovirus. N=5/group; †P < 0.01 vs. WT and *P < 0.01 vs. Ad-LacZ by two-way repeated measures ANOVA.
Figure 5
Figure 5. Independent manipulation of Δψ impacts endothelial phenotype
BAECs were transfected with irrelevant (Ad-LacZ) or UCP1 adenovirus (ad-UCP1) and examined for (A) Δψ, (B) proliferation, (C) migration, and (D) mitochondrial •O2- as described in “Methods.” N=4 – 6; *P<0.05 vs. Ad-LacZ by unpaired t-test.
Figure 6
Figure 6. UCP2 and endothelial senescence
(A) Cell cycle analysis in WT and UCP2-null MLECs at the indicated time. (B) Expression of WT and UCP2-null mRNA for p16ink4a and p21cip/waf. N=3; *P<0.05 vs. WT by Mann-Whitney U-test. (C) Expression of WT and UCP2-null endothelial p16ink4a and p21cip/waf by immunoblot. (D) WT and UCP2-null senescence-associated β-galactosidase (SA-βgal) via x-gal staining. Bar = 750 μm. (E) Endothelial SA-βgal staining as a function of genotype and transfection with either UCP2 or SOD2. N = 3-6; *P < 0.05 vs. WT + Ad-GFP, †P < 0.05 vs. UCP2-/- + Ad-GFP, and ‡P < 0.05 vs. SOD2+/- + Ad-GFP by Kruskal-Wallis ANOVA and post hoc comparison. (F) Cell proliferation in WT and UCP2-/- MLECs treated with none, control, or p53 siRNA. N=4; *P < 0.05 vs. WT with control siRNA; **P < 0.01 vs. WT with no treatment; †P < 0.01 vs. WT with control siRNA; and ‡P < 0.01 vs. UCP2-/- with control siRNA by one-way ANOVA with Tukey-Kramer test. (G) MLECs of the indicated genotype under normoxic or hypoxic (1% O2) conditions for 16h were lysed and probed for the indicated proteins by immunoblot.
Figure 7
Figure 7. Mitochondrial morphology and endothelial phenotype
(A) Representative images of MLEC mitochondrial morphology by Mitotracker green staining as a function of the indicated genotype and/or transfection with the indicated adenovirus (Ad). (B) Composite data indicating average mitochondrial length as an index of fragmentation in MLECs from the indicated genotype and/or transfected with the indicated adenovirus. N=13 – 16; *P < 0.01 vs. respective wild-type or LacZ control by Kruskal-Wallis ANOVA. (C) Mitochondrial length as an index of fragmentation in the indicated genotypes with and without suppression of p53. N=12 – 16; *P < 0.05 vs. respective control. (D) MLEC mitochondrial morphology and average length with forced expression of p21cip/waf (bar = 5 μm; N=9 – 13; *P < 0.05 vs. LacZ by Kruskal-Wallis ANOVA. (E) MLEC expression of mitochondrial genes as a function of the indicated genotype. N=3 – 4; *P < 0.05, **P < 0.01 vs. WT by Mann-Whitney U-test. (F) WT MLEC proliferation with suppression of mitofusin 2 (Mfn2) or both mitofusin 1 (Mfn1) and Mfn2. N=10 each; *P < 0.05 vs. CTL siRNA by two-way repeated measures ANOVA.

Comment in

Similar articles

Cited by

References

    1. Mitchell P. Coupling of phosphorylation to electron and hydrogen transfer by a chemi-osmotic type of mechanism. Nature. 1961;191:144–148. - PubMed
    1. Jiang X, Wang X. Cytochrome C-mediated apoptosis. Annu Rev Biochem. 2004;73:87–106. - PubMed
    1. Ajioka RS, Phillips JD, Kushner JP. Biosynthesis of heme in mammals. Biochim Biophys Acta. 2006;1763:723–736. - PubMed
    1. Berridge MJ, Bootman MD, Roderick HL. Calcium signalling: dynamics, homeostasis and remodelling. Nat Rev Mol Cell Biol. 2003;4:517–529. - PubMed
    1. Seth RB, Sun L, Ea CK, Chen ZJ. Identification and characterization of MAVS, a mitochondrial antiviral signaling protein that activates NF-kappaB and IRF 3. Cell. 2005;122:669–682. - PubMed

Publication types

MeSH terms