. 2013 Aug;9(8):1201-13.
doi: 10.4161/auto.24811. Epub 2013 May 14.

Drosophila Fip200 is an essential regulator of autophagy that attenuates both growth and aging

Affiliations

Drosophila Fip200 is an essential regulator of autophagy that attenuates both growth and aging

Myungjin Kim et al. Autophagy. 2013 Aug.

Abstract

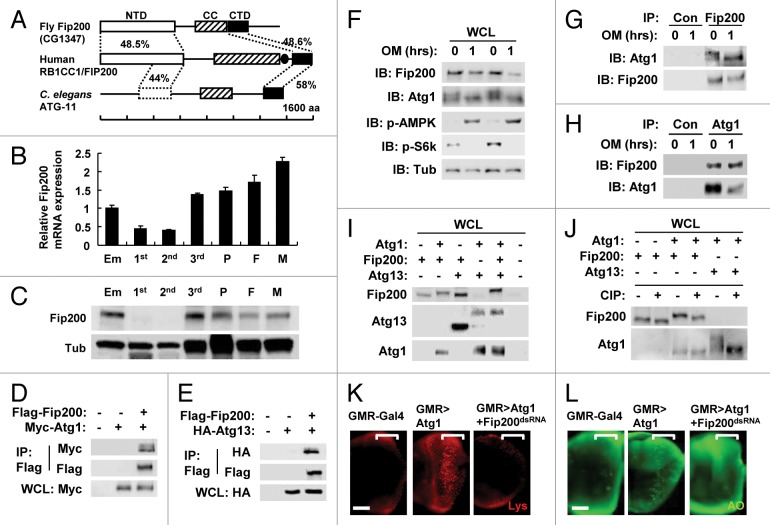
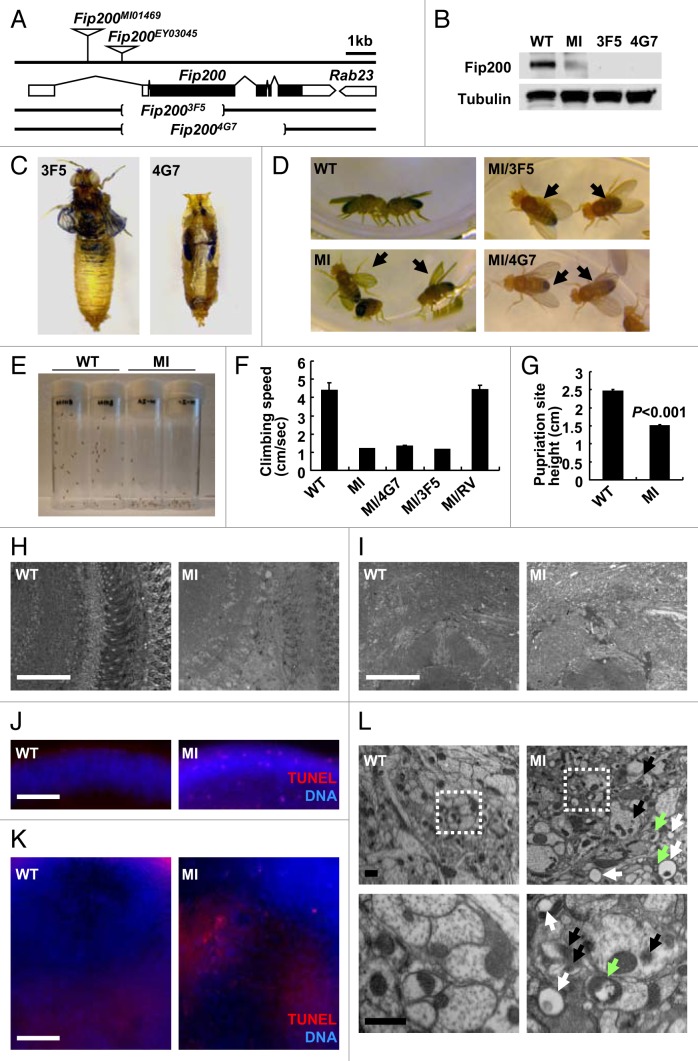
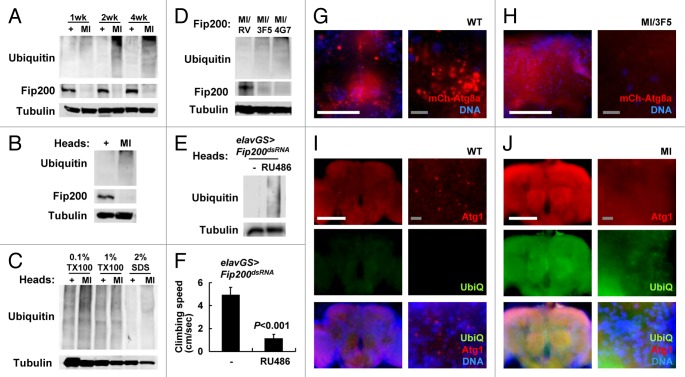
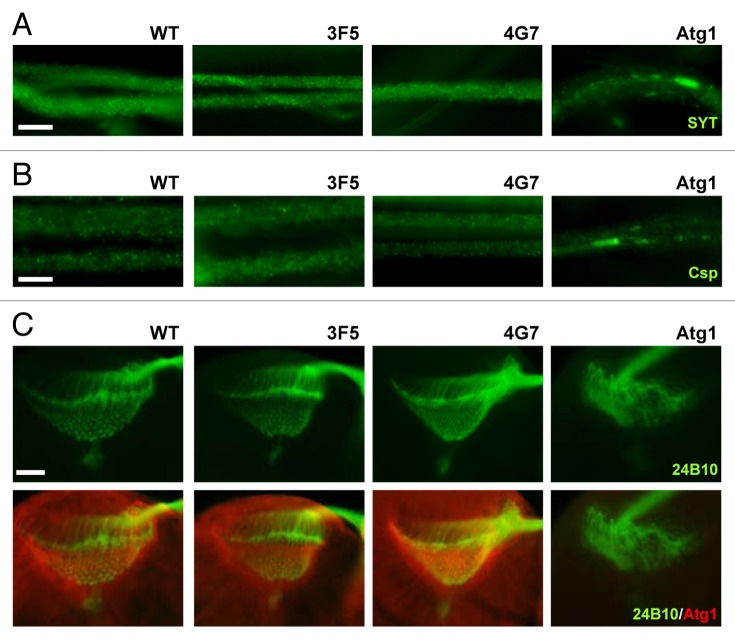
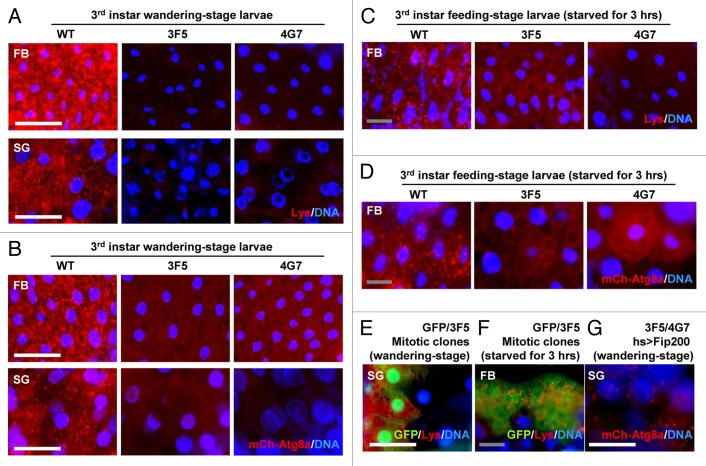
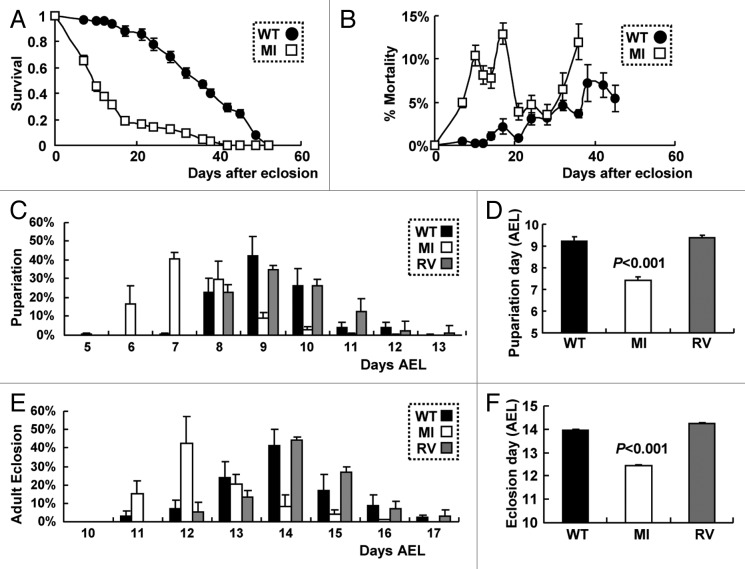
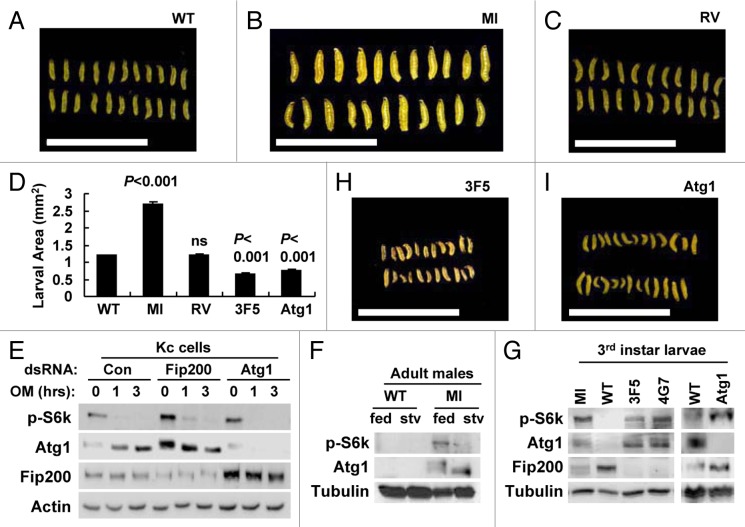
Autophagy-related 1 (Atg1)/Unc-51-like protein kinases (ULKs) are evolutionarily conserved proteins that play critical physiological roles in controlling autophagy, cell growth and neurodevelopment. RB1-inducible coiled-coil 1 (RB1CC1), also known as PTK2/FAK family-interacting protein of 200 kDa (FIP200) is a recently discovered binding partner of ULK1. Here we isolated the Drosophila RB1CC1/FIP200 homolog (Fip200/CG1347) and showed that it mediates Atg1-induced autophagy as a genetically downstream component in diverse physiological contexts. Fip200 loss-of-function mutants experienced severe mobility loss associated with neuronal autophagy defects and neurodegeneration. The Fip200 mutants were also devoid of both developmental and starvation-induced autophagy in salivary gland and fat body, while having no defects in axonal transport and projection in developing neurons. Interestingly, moderate downregulation of Fip200 accelerated both developmental growth and aging, accompanied by target of rapamycin (Tor) signaling upregulation. These results suggest that Fip200 is a critical downstream component of Atg1 and specifically mediates Atg1's autophagy-, aging- and growth-regulating functions.

Keywords: Drosophila; aging; autophagy; growth; neurodegeneration.


Figures

None
Figure 1. Conservation of RB1CC1/FIP200 in Drosophila. (A) Schematic representation of the comparison among Drosophila, human and C. elegans RB1CC1 homologs. Amino acid sequence similarity is displayed as a percentage. NTD, N-terminal domain; CC, coiled-coil domain; CTD, C-terminal domain; aa, amino acids. Leucine zipper domain in human RB1CC1 is indicated as a closed circle. NTD is only partially conserved in C. elegans ATG-11. (B and C) Expression of Fip200 at different developmental stages of Drosophila. Em, embryo; 1st, first instar larva; 2nd, second instar larva; 3rd, wandering-stage third instar larva; P, pupa; F, adult female; M, adult male. Quantitative reverse transcriptase-real time polymerase chain reaction was performed, and Fip200 mRNA expression was normalized with ribosomal protein 49 expression (B), n = 3. Quantification data are represented as means ± standard error. Immunoblot analysis was performed to reveal Fip200 and tubulin (Tub) expression (C). (D–J) Physical interaction among Atg1, Fip200 and Atg13. (D, E, I and J) After transfection with the indicated constructs, Drosophila Kc cells were incubated for 48 h. Whole cell lysates (WCL) were prepared and subsequently subjected to immunoprecipitation (IP) with or without (Con) the indicated antibodies. WCL and IP samples were analyzed by immunoblotting with the indicated antibodies. (J) WCL was incubated with or without calf intestine phosphatase (CIP) at 30°C for 3 h. (F–H) Kc cells were treated with 5 μM oligomycin (OM) for 1 h as indicated and were subjected to WCL-IP sample preparation and immunoblotting (IB) with the indicated antibodies. (K and L) Eye imaginal discs from wandering-stage third instar larvae of the indicated genotypes were subjected to LysoTracker Red (Lys, K) and acridine orange (AO, L) staining. Brackets indicate the area where GMR-Gal4 and transgenes were expressed. Scale bar: 50 μm. Approximate molecular weights (observed/predicted): Fip200 (150 to 200/152 kD), Atg1 (120 to 150/92 kD), Atg13 (60 to 70/57 kD), SNF1A/AMPK (70/65 kD), S6k (60/55 kD), Tub (50/52 kD). Endogenous and overexpressed protein bands exhibited similar size.
None
Figure 2. Phenotypes of Drosophila Fip200 mutants. (A) Schematic genomic organization of the Fip200 (CG1347) locus and Fip200 mutants. Brackets indicate the genomic deficiency in Fip200-null alleles. Triangles indicate transposon insertions. Open boxes: untranslated exons; closed boxes: protein-coding exons; size bar: relative length of 1 kb genomic span. (B) Absence of Fip200 protein in Fip200 mutant flies. Protein samples from wandering third-instar larvae of wild type (WT; Fip200+/+), MI (Fip200MI/MI), 3F5 (Fip2003F5/3F5) and 4G7 (Fip2004G7/4G7) were gel separated and immunoblotted with anti-Fip200 and anti-tubulin antibodies. (C) Pupal (pharate adult) lethality of Fip200-null mutants. Most of the 3F5 and 4G7 mutant flies die before or during eclosion. (D) Wing posture defects of Fip200 hypomorphs. WT, MI, MI/3F5 (Fip200MI/3F5) and MI/4G7 (Fip200MI/4G7) adult male flies. Complete phenotypic description of each mutant strain is summarized in Table S1 and S2. (E–G) Mobility defects of Fip200 hypomorphs. (E) A photograph of vials containing 2-week-old WT and MI flies taken 3 sec after negative geotaxis induction. (F) Quantification of climbing speed of the indicated 2-week-old adult male flies (n ≥ 10). Complete statistical comparison between each strain is summarized in Table S3. (G) Quantification of pupariation site height of the indicated fly strains (n > 480). (H and I) Semi-thin section of 2-week-old adult fly brain. Optic lobe (H) and central brain (I) regions were magnified to reveal moderate vacuolization in MI mutant brain. (J and K) TUNEL (red) and DAPI (blue, DNA) staining of 2-week-old adult fly brain. Optic lobe (J) and central brain (K) regions of MI mutant brain shows moderate apoptosis induction. (L) Electron micrographs reveal the presence of ectopic vacuoles (white arrows), inclusion bodies (black arrows) and dysfunctional mitochondria (green arrows) in 2-week-old MI brain (right panels) but not in wild-type control brain (left panels). Lower panels are magnified view of boxed regions in upper panels. Scale bars: 50 μm (white), 2 μm (black). Quantification data are represented as means ± standard error. p value was calculated using Student’s t-test. Approximate molecular weights (observed/predicted): Fip200 (150 to 200/152 kD), Tubulin (50/52 kD).
None
Figure 3. Protein homeostasis and autophagy defects in Fip200 mutant brain. (A–D) Accumulation of ubiquitin in Fip200 hypomorphs. (A, B and D) Adult male flies (A and D) or heads (B) of wild-type (+), Fip200MI (MI), Fip200MI/Fip200RV (MI/RV), Fip200MI/Fip2003F5 (MI/3F5) and Fip200MI/Fip2004G7 (MI/4G7) at the indicated ages (A) or at 2 weeks of age (B) were subjected to immunoblot analyses with the indicated antibodies. (C) 50 adult fly heads of indicated 2-week-old adult flies were subjected to serial protein extraction with the indicated concentration of Triton X-100 (TX100) or sodium dodecyl sulfate (SDS) and were analyzed by immunoblotting with the indicated antibodies. (E and F) Temporal silencing of Fip200 in adult neurons is sufficient to induce neurodegenerative phenotypes. 1-week-old elav-GS > Fip200dsRNA flies were cultured for two weeks on standard media (-) or on media supplemented with 200 mM RU486 and were assayed for ubiquitin accumulation (E) and climbing abilities (F). (G and H) Autophagic activities are decreased in MI brain. Fluorescence images of adult fly brain from 2-week-old hs > mCherry-Atg8a/+ (WT) and Fip200MI/hs > mCherry-Atg8a Fip2003F5 (MI/3F5) after eclosion. mCherry-Atg8a (mCh-Atg8a, red) was induced by overnight exposure to low-grade heat shock (29°C), and nuclei in live cells were stained with Hoechst 33258 (DNA, blue). (I an J) Increased ubiquitin (UbiQ, green) and Atg1 (Atg1, red) levels in MI brain. 2-week-old WT and MI fly brains were dissected and subjected to immunostaining with anti-ubiquitin (UbiQ) and anti-Atg1 antibodies. DNA was visualized with DAPI staining. Scale bars: 200 μm (white), 10 μm (gray). Quantification data are represented as means ± standard error. p value was calculated using Student’s t-test. Approximate molecular weights (observed/predicted): Fip200 (150 to 200/152 kD), Tubulin (50/52 kD). As cellular proteins of diverse molecular weights are mono- or polyubiquitinated, ubiquitin immunoblots show a smeared banding pattern toward the top of the gel, as previously reported.
None
Figure 4. Axonal growth, projection and transport are unaffected by Fip200 loss. (A and B) Motor neurons from wandering-stage third instar larvae were immunostained with the indicated antibodies. In Fip200-null mutant (3F5 and 4G7) motor neurons, axonal traffic of synaptotagmin (SYT), (A) and cysteine string protein (Csp), (B) cargo molecules were normal and indistinguishable from WT motor neurons. However, the proteins became aggregated in Atg1-null (Atg1Δ3d/Df(3)BSC10) motor neurons. (C) Wandering-stage third instar larval brain was immunostained with the indicated antibodies. In both WT and Fip200-null mutant brains, axons of eye photoreceptor cells, visualized by 24B10 monoclonal antibodies, show stereotyped projection to lamina and medulla region, and Atg1 prominently localizes to axons in lamina of the brain optic lobes. Atg1-null (Atg1Δ3d/Df(3)BSC10) brains show disruption of this structure. Scale bars: 20 μm.
None
Figure 5. Fip200 is essential for developmental and starvation-induced autophagy. (A) Fat bodies (FB) and salivary glands (SG) of wandering-stage third instar larvae of WT, 3F5 and 4G7 flies were subjected to LysoTracker Red (Lys) and Hoechst 33258 (DNA) staining. (B) FB and SG of wandering-stage third instar larvae of hs > mCherry-Atg8a/+ (WT), hs > mCherry-Atg8a Fip2003F5/Fip2003F5 (3F5) and hs > mCherry-Atg8a Fip2004G7/Fip2004G7 (4G7) flies, heat-shocked at 37°C for 1 h to induce mCherry-Atg8a and recovered at 25°C for 3 h, were stained with Hoechst 33258 (DNA) and observed under fluorescence microscopy. (C) FB from feeding-stage third instar larvae of WT, 3F5 and 4G7, starved for 3 h, were subjected to Lys and DNA staining. (D) FB from feeding-stage third instar larvae of hs > mCherry-Atg8a/+ (WT), hs > mCherry-Atg8a Fip2003F5/Fip2003F5 (3F5) and hs > mCherry-Atg8a Fip2004G7/Fip2004G7 (4G7) flies, heat-shocked at 37°C for 1 h and incubated on 20% sucrose solution at 25°C for 3 h, were subjected to DNA staining. (E) SG from wandering-stage third instar larvae of y w hs-FLP; FRT82B Ubi-eGFP/FRT82B Fip2003F5 (GFP/3F5) flies were subjected to Lys and DNA staining. Absence of GFP marks Fip200-deficient cells, which also have less Lys staining. (F) FB from feeding-stage third instar larvae of y w hs-FLP; FRT82B Ubi-eGFP/FRT82B Fip2003F5 (GFP/3F5) flies, starved for 3 h, were subjected to Lys and DNA staining. (G) SG of wandering-stage third instar larvae of UAS-Fip200/+; hs > mCherry-Atg8a Fip2003F5/Fip2004G7 (3F5/4G7 hs > Fip200) flies, heat-shocked at 37°C for 1 h and recovered at 25°C for 3 h, were subjected to DNA staining. Scale bar: 200 μm (white), 50 μm (gray).
None
Figure 6. Hypomorphic Fip200MI mutation accelerates both aging and development. (A and B) Survivorship (A) and daily mortality (B) of WT and MI male flies (n ≥ 380). (C and D) Pupariation rates of WT, RV and MI flies were recorded at the indicated days after egg laying (C), AEL. Average pupariation day AEL was calculated and presented as a bar graph (D), n ≥ 500. (E and F) Adult eclosion rates of WT, RV and MI flies were recorded at the indicated days AEL (E). Average eclosion day AEL was calculated and presented as a bar graph (F, n ≥ 500). Quantification data are represented as means ± standard error. p values were calculated between WT and MI groups using Student’s t-test.
None
Figure 7. Fip200 loss induces TORC1-S6k activation. (A–C, H and I) Feeding-stage larvae of the indicated strains at 4 d AEL were imaged through dissection microscope. (D) Average larval area from the images was calculated and presented as a bar graph (n ≥ 22). Quantification data are represented as means ± standard error. p values were calculated between WT and indicated groups using Student’s t-test. (E) Drosophila Kc cells treated with the indicated dsRNA for 3 d were treated with 5 μM oligomycin (OM) for the indicated hours and subjected to immunoblotting with the indicated antibodies. (F) 1-week-old adult male flies of the indicated genotypes were incubated on standard media (fed) or 20% sucrose media (stv) for 24 h and subjected to immunoblotting with the indicated antibodies. (G) Wandering-stage third instar larvae of the indicated strains were subjected to immunoblotting with the indicated antibodies. Scale bar: 1 cm. Approximate molecular weights (observed/predicted): Fip200 (150 to 200/152 kD), Atg1 (120 to 150/92 kD), S6k (60/55 kD), Actin (48/42 kD), Tub (50/52 kD).

Similar articles

Cited by

References

    1. Yen WL, Klionsky DJ. How to live long and prosper: autophagy, mitochondria, and aging. Physiology (Bethesda) 2008;23:248–62. doi: 10.1152/physiol.00013.2008. - DOI - PubMed
    1. Singh R, Cuervo AM. Autophagy in the cellular energetic balance. Cell Metab. 2011;13:495–504. doi: 10.1016/j.cmet.2011.04.004. - DOI - PMC - PubMed
    1. Levine B, Mizushima N, Virgin HW. Autophagy in immunity and inflammation. Nature. 2011;469:323–35. doi: 10.1038/nature09782. - DOI - PMC - PubMed
    1. Komatsu M, Waguri S, Chiba T, Murata S, Iwata J, Tanida I, et al. Loss of autophagy in the central nervous system causes neurodegeneration in mice. Nature. 2006;441:880–4. doi: 10.1038/nature04723. - DOI - PubMed
    1. Yue Z, Jin S, Yang C, Levine AJ, Heintz N. Beclin 1, an autophagy gene essential for early embryonic development, is a haploinsufficient tumor suppressor. Proc Natl Acad Sci U S A. 2003;100:15077–82. doi: 10.1073/pnas.2436255100. - DOI - PMC - PubMed

Publication types

MeSH terms

LinkOut - more resources