. 2013 Sep 15;63(2):188-99.
doi: 10.1016/j.ymeth.2013.05.028. Epub 2013 Jun 29.

Dissecting non-coding RNA mechanisms in cellulo by Single-molecule High-Resolution Localization and Counting

Affiliations

Dissecting non-coding RNA mechanisms in cellulo by Single-molecule High-Resolution Localization and Counting

Sethuramasundaram Pitchiaya et al. Methods. .

Abstract

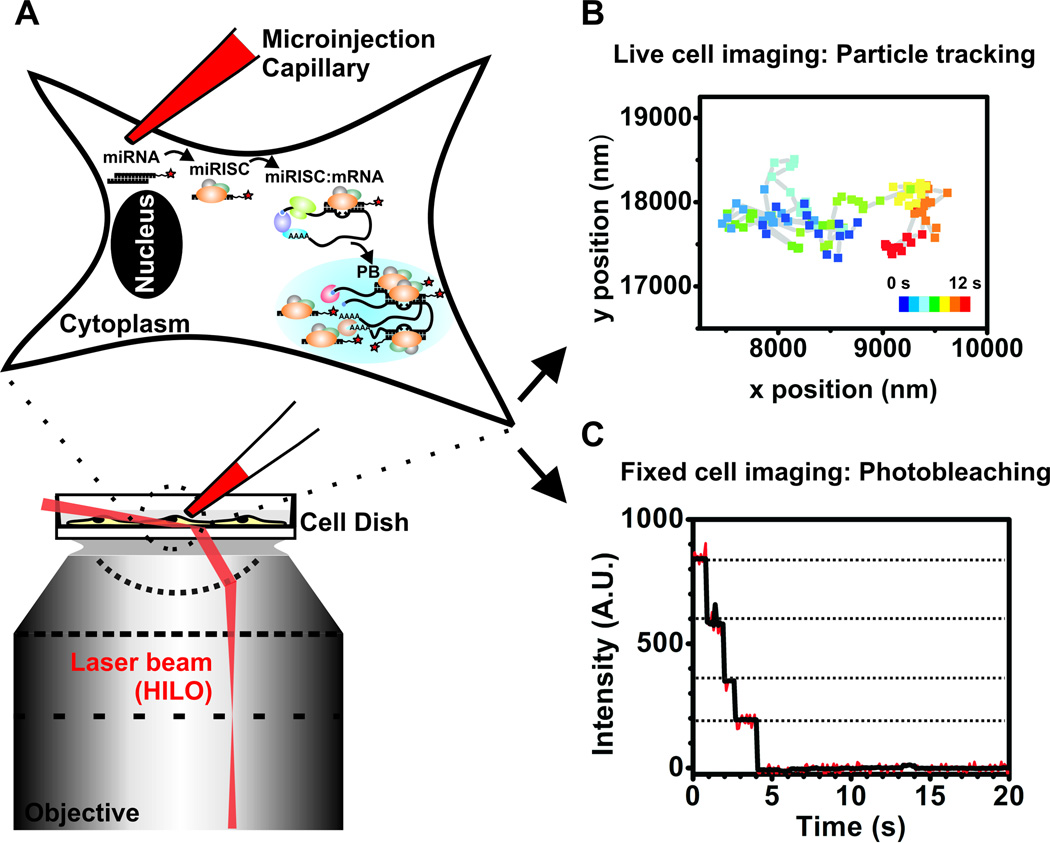
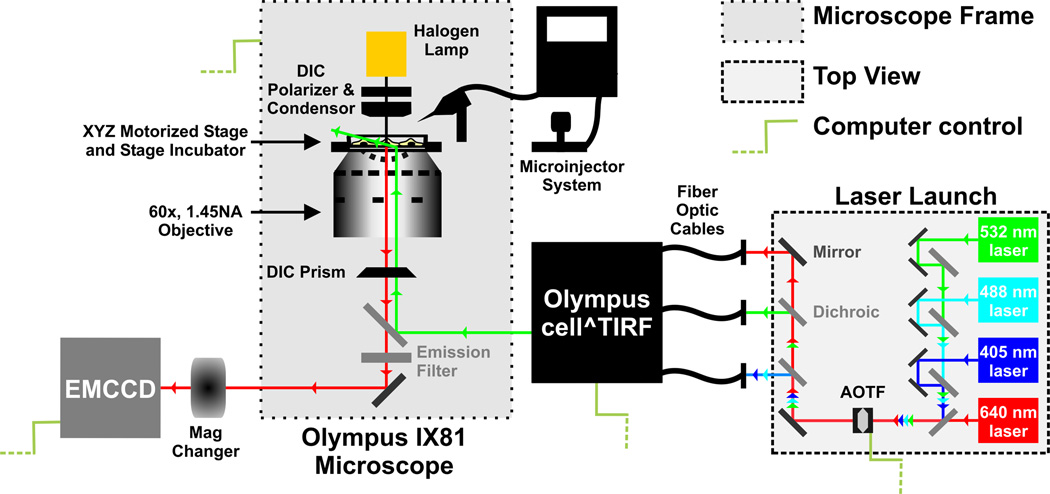
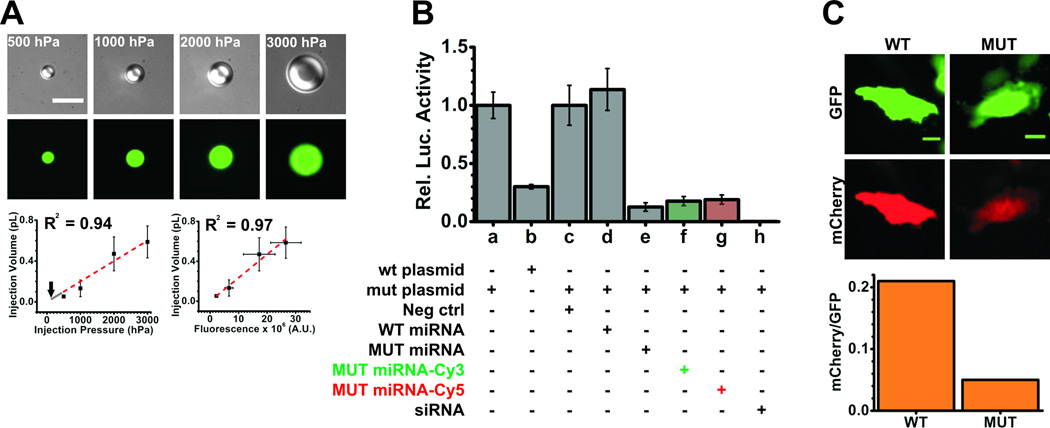
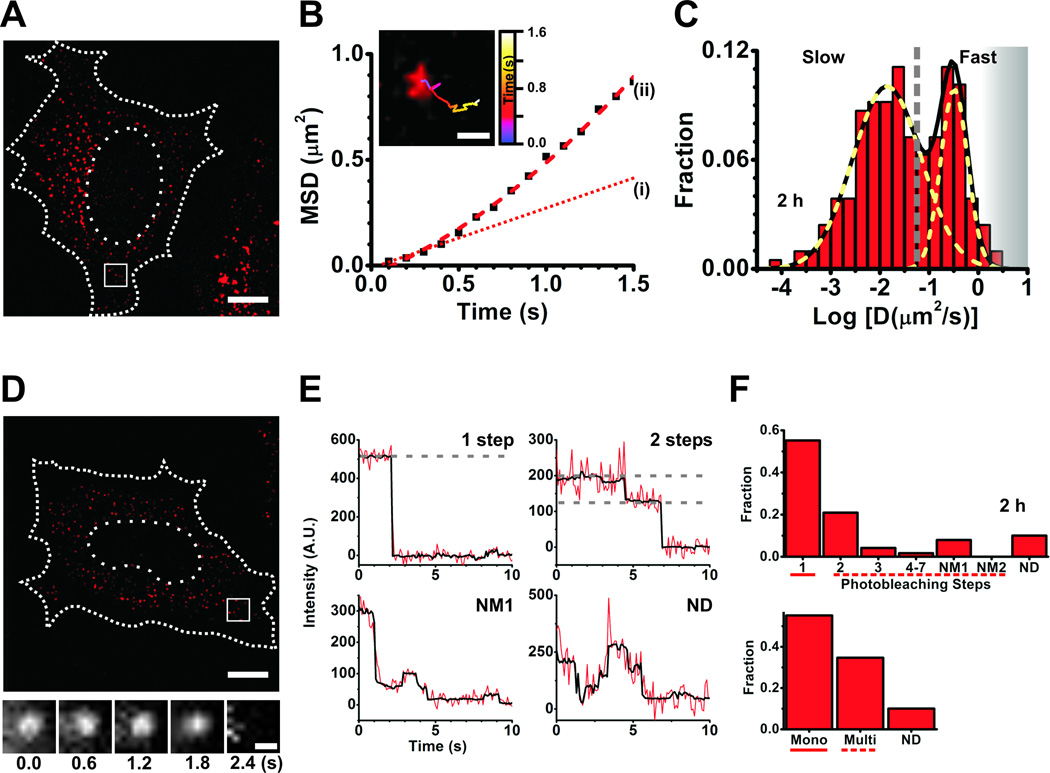
Non-coding RNAs (ncRNAs) recently were discovered to outnumber their protein-coding counterparts, yet their diverse functions are still poorly understood. Here we report on a method for the intracellular Single-molecule High-Resolution Localization and Counting (iSHiRLoC) of microRNAs (miRNAs), a conserved, ubiquitous class of regulatory ncRNAs that controls the expression of over 60% of all mammalian protein coding genes post-transcriptionally, by a mechanism shrouded by seemingly contradictory observations. We present protocols to execute single particle tracking (SPT) and single-molecule counting of functional microinjected, fluorophore-labeled miRNAs and thereby extract diffusion coefficients and molecular stoichiometries of micro-ribonucleoprotein (miRNP) complexes from living and fixed cells, respectively. This probing of miRNAs at the single molecule level sheds new light on the intracellular assembly/disassembly of miRNPs, thus beginning to unravel the dynamic nature of this important gene regulatory pathway and facilitating the development of a parsimonious model for their obscured mechanism of action.

Keywords: Non-coding RNA; RNA silencing; Single molecule microscopy; Single particle tracking; microRNA.


Figures

Figure 1
Figure 1
Schematic of iSHiRLoC.
Figure 2
Figure 2
Schematic of the microscope used for iSHiRLoC.
Figure 3
Figure 3
Control experiments. (A) Microinjector calibration. Fluorescein dextran (0.5 mg/ml, 10 kDa) reconstituted in PBS was injected into cargille type FF oil at injection pressures ranging from 500–3000 hPa. Top, representative DIC (gray scale) and fluorescence images (green) of fluorescein dextran droplets (top) at different injection pressure. Scale bar, 10 µm. Bottom left, injection volume as calculated from the volume of dextran droplets was plotted as a function of injection pressure and fit by linear regression (y = 0.0002×, red dotted line). Grey line shows extrapolation of fit to 100 hPa, marked by an arrow, which corresponds to an injection volume of 0.02 pL and translates to ~18,000 molecules of miRNAs injected at a concentration of 1.5 µM. Error bars, standard deviation of at least 3 independent microinjections. Bottom right, plot of injection (or dextran droplet) volume versus fluorescence, also fit by linear regression (y = 0.0235×10⁶x, red dotted line). In either case, the linearity was not maintained beyond 3,000 hPa injection pressure. (B) Functional analyses of miRNAs using luciferase assays. HeLa cells were co-transfected with luciferase reporter plasmids and double-stranded (ds) small RNAs. The plasmids either contained the wild-type (wt) or mutant (mut) 3`UTR of HMGA2. Ds-RNA (50 nM) was a negative control siRNA (neg ctrl), wt-let-7-a1 miRNA (WT miRNA), mut-let-7-a1 miRNA (MUT miRNA, with or without fluorophore) or a positive control luciferase siRNA (siRNA). Firefly luciferase activity was normalized with Renilla luciferase activity within each sample. wt (a) and mut (b) plasmid samples were normalized with respect to (a) to show the expression of the wt plasmid relative to the mut plasmid. The reporter bearing the wt 3`UTR is strongly repressed by endogenous let-7-a1 miRNA. All other samples were normalized with respect to the neg ctrl (c) sample. (C) Functional analyses of miRNAs using fluorescence reporter assays. Representative pseudocolored images (top) of HeLa cells expressing GFP (green) and mCherry (red) from samples that were injected with the mut 3`UTR containing mCherry reporter plasmid, GFP control plasmid and either the WT (seed-mismatch) or MUT (seed-match) miRNA. Scale bar, 20 µm. The bottom panel represents quantification of the mCherry fluorescence relative to the GFP fluorescence in the cells above.
Figure 4
Figure 4
Single particle tracking and single molecule counting. (A–C) Data from single particle tracking experiments in live HeLa cells. (A) A representative background-subtracted pseudocolored image of a cell injected with 1.5 µM let-7-a1-Cy5 miRNA and fluorescein dextran (injection marker), imaged 2 h post-microinjection. Scale bar, 10 µm. Dashed and dotted lines represent cell and nuclear boundaries, respectively. (B) Plot of mean squared displacement (MSD) versus time of the track within the inset. Scale bar within inset, 500 nm. The track corresponds to the particle within the white box in (A). Brownian micro-diffusion coefficient (D(i)), calculated from the first three data points of the MSD versus time plot, is 0.0561 µm2/s, whereas the diffusion coefficient calculated by best-fitting all data points with a parabolic curve, the canonical equation for a particle exhibiting biased motion, yields D(ii) = 0.085 µm2/s (velocity = 0.43 µm/s). The line fitted to the first three data points is extrapolated for ease of viewing (dotted red line (i)). Based on RD analysis, we do not find a significant difference in the number of particles exhibiting non-Brownian diffusion between sample sets. As we are interested only in the change in diffusion coefficient and not its actual magnitude, such differences do not significantly affect our analyses. (C) Distribution of Brownian micro-diffusion coefficients calculated from individual let-7-a-Cy5 particles in (A), that were visible for at least 9 consecutive frames. Particles distributed into at least two distinct Gaussian populations of diffusion coefficients, with an average of diffusion coefficients of 0.322 µm2/s and 0.014 µm2/s. The grey dashed line represents a crude demarcation of the fast and slow moving particles that resemble mRNPs and PBs, respectively. The grey shaded region represents diffusion coefficients of fast moving particles that we increasingly lose either due to time resolution limitations or due to our stringent track length threshold for calculating diffusion coefficient. (D–F) Data from single molecule counting experiments in formaldehyde-fixed HeLa cells. (D) A representative background subtracted, pseudocolored image of a cell injected with 0.25 µM let-7-a1-Cy5 miRNA and 10 kDa fluorescein-dextran, imaged 2 h after microinjection. Scale bar, 10 µm. Dashed and dotted lines represent cell and nuclear boundaries, respectively. Cells were imaged immediately after fixation. The bottom panel contains a set of frames that shows the photobleaching of a miRNA particle, within the white box in (D), over the indicated time. Scale bar, 500 nm. (E) Representative photobleaching trajectories of particles in (D). Grey dashed lines are drawn to guide the eye to discrete intensity levels. (F) Distribution of photobleaching steps corresponding to particles in (D). The bottom panel represents particles either grouped as monomers (photobleaching steps spanning solid line in top panel), multimers (photobleaching steps spanning dashed line in top panel) or non-discernible (ND).

References

    1. Carninci P. Nat. Cell Biol. 2008;10:1023–1024. - PubMed
    1. Bernstein BE, Birney E, Dunham I, Green ED, Gunter C, Snyder M. Nature. 2012;489:57–74. - PubMed
    1. Schmeing TM, Ramakrishnan V. Nature. 2009;461:1234–1242. - PubMed
    1. Kruger K, Grabowski PJ, Zaug AJ, Sands J, Gottschling DE, Cech TR. Cell. 1982;31:147–157. - PubMed
    1. Esteller M. Nat. Rev. Genet. 2011;12:861–874. - PubMed

Publication types

LinkOut - more resources