. 2013 Nov;34(11):2510-6.
doi: 10.1016/j.neurobiolaging.2013.05.017. Epub 2013 Jun 29.

Striatal shape in Parkinson's disease

Affiliations

Striatal shape in Parkinson's disease

Nicholas W Sterling et al. Neurobiol Aging. 2013 Nov.

Abstract

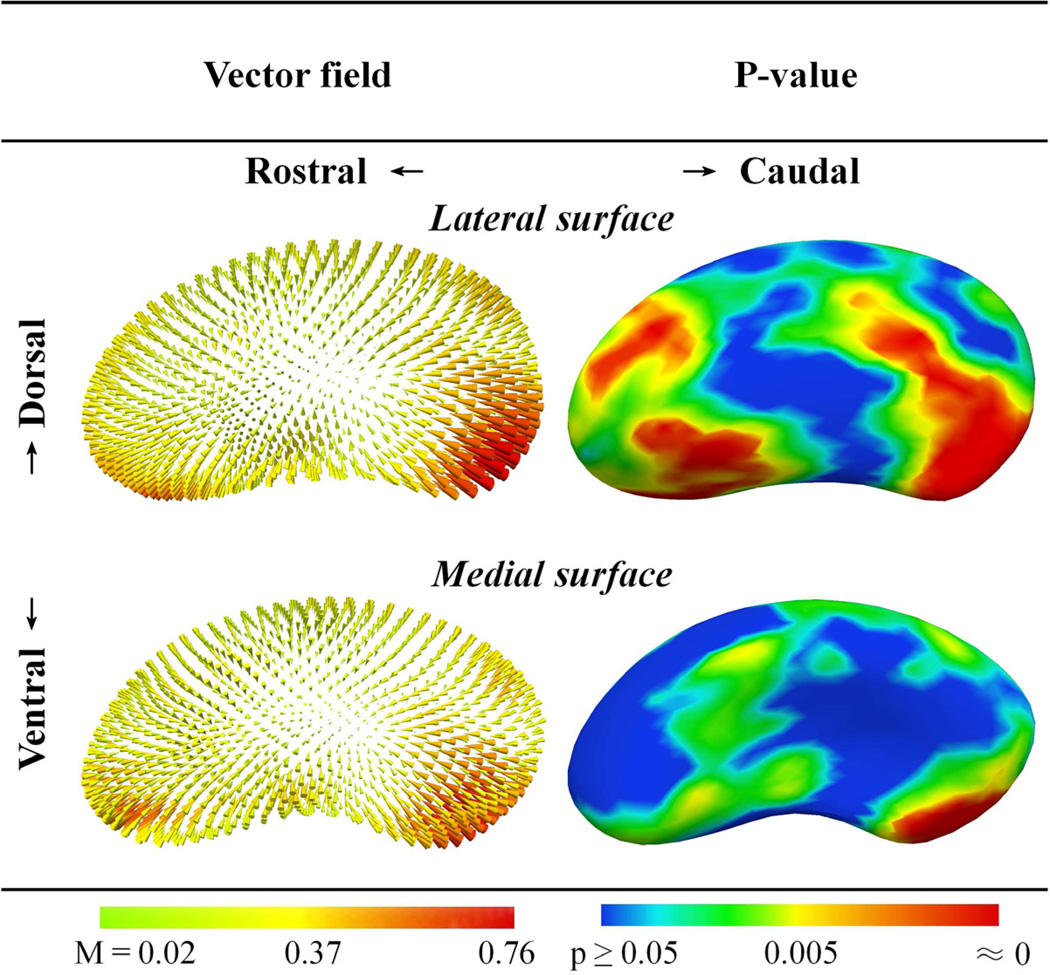
Parkinson's disease (PD) is marked pathologically by nigrostriatal dopaminergic terminal loss. Histopathological and in vivo labeling studies demonstrate that this loss occurs most extensively in the caudal putamen and caudate head. Previous structural studies have suggested reduced striatal volume and atrophy of the caudate head in PD subjects. The spatial distribution of atrophy in the putamen, however, has not been characterized. We aimed to delineate the specific locations of atrophy in both of these striatal structures. T1- and T2-weighted brain MR (3T) images were obtained from 40 PD and 40 control subjects having no dementia and similar age and gender distributions. Shape analysis was performed using doubly segmented regions of interest. Compared to controls, PD subjects had lower putamen (p = 0.0003) and caudate (p = 0.0003) volumes. Surface contraction magnitudes were greatest on the caudal putamen (p ≤ 0.005) and head and dorsal body of the caudate (p ≤ 0.005). This spatial distribution of striatal atrophy is consistent with the known pattern of dopamine depletion in PD and may reflect global consequences of known cellular remodeling phenomena.

Keywords: Caudate; Magnetic resonance imaging (MRI); Morphology; Parkinson's disease; Putamen; Shape; Striatum; Structure; Volume.


Conflict of interest statement

Disclosure Statement

The authors report no conflicts of interest.

Figures

Figure 1
Figure 1
Putamen shape differences between 40 PD and 40 control subjects. Displacement vectors indicate the direction and magnitude (M) of distance from the average control surface to the average PD surface. FDR-adjusted p-values are for comparisons between PD and control structures, adjusted for age and gender. The greatest magnitudes of surface contraction were located on the caudal putamen. Structures were pooled bilaterally and scaled to account for variations in intracranial volume.
Figure 2
Figure 2
Caudate shape differences between 40 PD and 40 control subjects. Displacement vectors indicate the direction and magnitude (M) of distance from the average control surface to the average PD surface. FDR-adjusted p-values are for comparisons between PD and control structures, adjusted for age and gender. The greatest magnitudes of surface contraction were located on the rostral caudate head. Structures were pooled bilaterally and scaled to account for variations in intracranial volume.
Figure 3
Figure 3
Correlation of putamen shape and MoCA scores in 40 PD subjects. Worsening MoCA scores are related to contraction of the dorsal and rostroventral surfaces. Pearson’s R and FDR-adjusted p-value maps represent correlations between signed distance from average surface at each surface point and MoCA score residuals after regression for age and gender. Structures were pooled bilaterally and scaled to account for variations in intracranial volume.
Figure 4
Figure 4
Correlation of caudate shape and MoCA scores in 40 PD subjects. Worsening MoCA scores are related to contractions on the dorsal surface and body of the caudate. Pearson’s R and FDR-adjusted p-value maps represent correlations between signed distance from average surface at each surface point and MoCA score residuals after regression for age and gender. Structures were pooled bilaterally and scaled to account for variations in intracranial volume.

References

    1. UNC NeuroImage Analysis Lab Manual. [Accessed 5-15-2012];IBIS Network. 2007 Online: http://ibis-network.org/unc/mri/roiprotocols.htm.
    1. Apostolova L, Beyer M, Green A, Hwang K, Morra J, Chou YY, Avedissian C, Aarsland D, Janvin C, Larsen J, Cummings J, Thompson P. Hippocampal, caudate, and ventricular changes in Parkinson's disease with and without dementia. Mov. Disord. 2010;25(6):687–782. - PMC - PubMed
    1. Becker JT, Sanders J, Madsen SK, Ragin A, Kingsley L, Maruca V, Cohen B, Goodkin K, Martin E, Miller EN. Subcortical brain atrophy persists even in HAART-regulated HIV disease. Brain Imaging Behav. 2011;5(2):77–85. - PMC - PubMed
    1. Bezard E, et al. Treating Parkinson's disease: preserve the spines!(Commentary on Soderstrom) Eur. J. Neurosci. 2010;31(3):477. - PubMed
    1. Braak H, Del Tredici K, Rub U, de Vos RA, Jansen Steur EN, Braak E. Staging of brain pathology related to sporadic Parkinson's disease Neurobiol. Aging. 2003;24(2):197–211. - PubMed

Publication types