Estrogen represses gene expression through reconfiguring chromatin structures
- PMID: 23821662
- PMCID: PMC3783169
- DOI: 10.1093/nar/gkt586
Estrogen represses gene expression through reconfiguring chromatin structures
Abstract
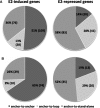
Estrogen regulates over a thousand genes, with an equal number of them being induced or repressed. The distinct mechanisms underlying these dual transcriptional effects remain largely unknown. We derived comprehensive views of the transcription machineries assembled at estrogen-responsive genes through integrating multiple types of genomic data. In the absence of estrogen, the majority of genes formed higher-order chromatin structures, including DNA loops tethered to protein complexes involving RNA polymerase II (Pol II), estrogen receptor alpha (ERα) and ERα-pioneer factors. Genes to be 'repressed' by estrogen showed active transcription at promoters and throughout the gene bodies; genes to be 'induced' exhibited active transcription initiation at promoters, but with transcription paused in gene bodies. In the presence of estrogen, the majority of estrogen-induced genes retained the original higher-order chromatin structures, whereas most estrogen-repressed genes underwent a chromatin reconfiguration. For estrogen-induced genes, estrogen enhances transcription elongation, potentially through recruitment of co-activators or release of co-repressors with unique roles in elongation. For estrogen-repressed genes, estrogen treatment leads to chromatin structure reconfiguration, thereby disrupting the originally transcription-efficient chromatin structures. Our in silico studies have shown that estrogen regulates gene expression, at least in part, through modifying previously assembled higher-order complexes, rather than by facilitating de novo assembly of machineries.
Figures


Similar articles
-
Genomic analyses of transcription factor binding, histone acetylation, and gene expression reveal mechanistically distinct classes of estrogen-regulated promoters.Mol Cell Biol. 2007 Jul;27(14):5090-104. doi: 10.1128/MCB.00083-07. Epub 2007 May 21. Mol Cell Biol. 2007. PMID: 17515612 Free PMC article.
-
E6-AP facilitates efficient transcription at estrogen responsive promoters through recruitment of chromatin modifiers.Steroids. 2011 Aug;76(9):897-902. doi: 10.1016/j.steroids.2011.04.007. Epub 2011 Apr 19. Steroids. 2011. PMID: 21530567
-
Gene-specific patterns of coregulator requirements by estrogen receptor-α in breast cancer cells.Mol Endocrinol. 2012 Jun;26(6):955-66. doi: 10.1210/me.2012-1066. Epub 2012 Apr 27. Mol Endocrinol. 2012. PMID: 22543272 Free PMC article.
-
RNA polymerase II elongation through chromatin.Nature. 2000 Sep 28;407(6803):471-5. doi: 10.1038/35035000. Nature. 2000. PMID: 11028991 Review.
-
The heat shock response: A case study of chromatin dynamics in gene regulation.Biochem Cell Biol. 2013 Feb;91(1):42-8. doi: 10.1139/bcb-2012-0075. Epub 2013 Feb 13. Biochem Cell Biol. 2013. PMID: 23442140 Review.
Cited by
-
Bivalent Epigenetic Control of Oncofetal Gene Expression in Cancer.Mol Cell Biol. 2017 Nov 13;37(23):e00352-17. doi: 10.1128/MCB.00352-17. Print 2017 Dec 1. Mol Cell Biol. 2017. PMID: 28923849 Free PMC article. Review.
-
International Union of Basic and Clinical Pharmacology CXIII: Nuclear Receptor Superfamily-Update 2023.Pharmacol Rev. 2023 Nov;75(6):1233-1318. doi: 10.1124/pharmrev.121.000436. Epub 2023 Aug 16. Pharmacol Rev. 2023. PMID: 37586884 Free PMC article. Review.
-
An extended catalogue of ncRNAs in Streptomyces coelicolor reporting abundant tmRNA, RNase-P RNA and RNA fragments derived from pre-ribosomal RNA leader sequences.Arch Microbiol. 2022 Sep;204(9):582. doi: 10.1007/s00203-022-03203-2. Epub 2022 Aug 30. Arch Microbiol. 2022. PMID: 36042049
-
Estrogen induces global reorganization of chromatin structure in human breast cancer cells.PLoS One. 2014 Dec 3;9(12):e113354. doi: 10.1371/journal.pone.0113354. eCollection 2014. PLoS One. 2014. PMID: 25470140 Free PMC article.
-
Prosaposin activates the androgen receptor and potentiates resistance to endocrine treatment in breast cancer.Breast Cancer Res. 2015 Sep 4;17(1):123. doi: 10.1186/s13058-015-0636-6. Breast Cancer Res. 2015. PMID: 26341737 Free PMC article.
References
-
- Osborne CK, Schiff R, Fuqua SA, Shou J. Estrogen receptor: current understanding of its activation and modulation. Clin. Cancer Res. 2001;7:4338s–4342s. discussion 4411s–4412s. - PubMed
-
- Carroll JS, Meyer CA, Song J, Li W, Geistlinger TR, Eeckhoute J, Brodsky AS, Keeton EK, Fertuck KC, Hall GF, et al. Genome-wide analysis of estrogen receptor binding sites. Nat. Genet. 2006;38:1289–1297. - PubMed
-
- Welboren WJ, Sweep FC, Span PN, Stunnenberg HG. Genomic actions of estrogen receptor alpha: what are the targets and how are they regulated? Endocr. Relat. Cancer. 2009;16:1073–1089. - PubMed
-
- Leitman DC, Paruthiyil S, Yuan C, Herber CB, Olshansky M, Tagliaferri M, Cohen I, Speed TP. Tissue-specific regulation of genes by estrogen receptors. Semin. Reprod. Med. 2012;30:14–22. - PubMed
Publication types
MeSH terms
Substances
Grants and funding
LinkOut - more resources
Full Text Sources
Other Literature Sources

