. 2013 Sep;41(17):8072-84.
doi: 10.1093/nar/gkt590. Epub 2013 Jul 1.

Genomic targets, and histone acetylation and gene expression profiling of neural HDAC inhibition

Affiliations

Genomic targets, and histone acetylation and gene expression profiling of neural HDAC inhibition

Jose P Lopez-Atalaya et al. Nucleic Acids Res. 2013 Sep.

Abstract

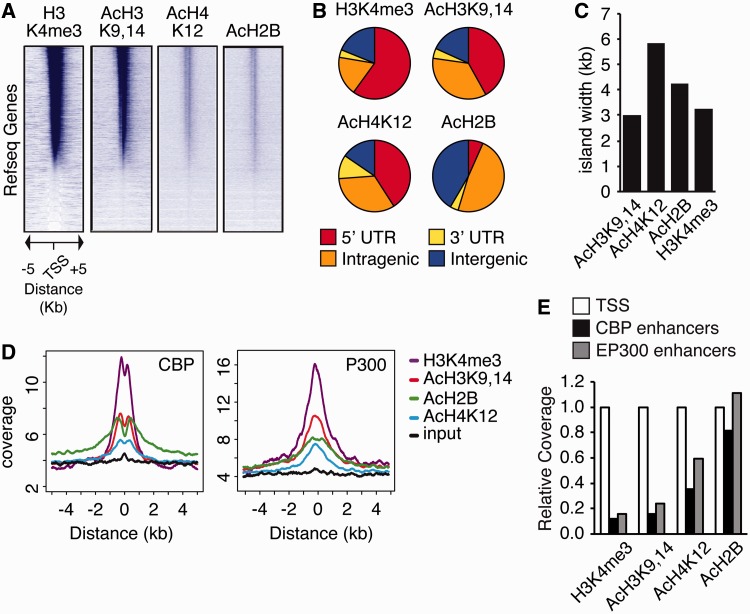
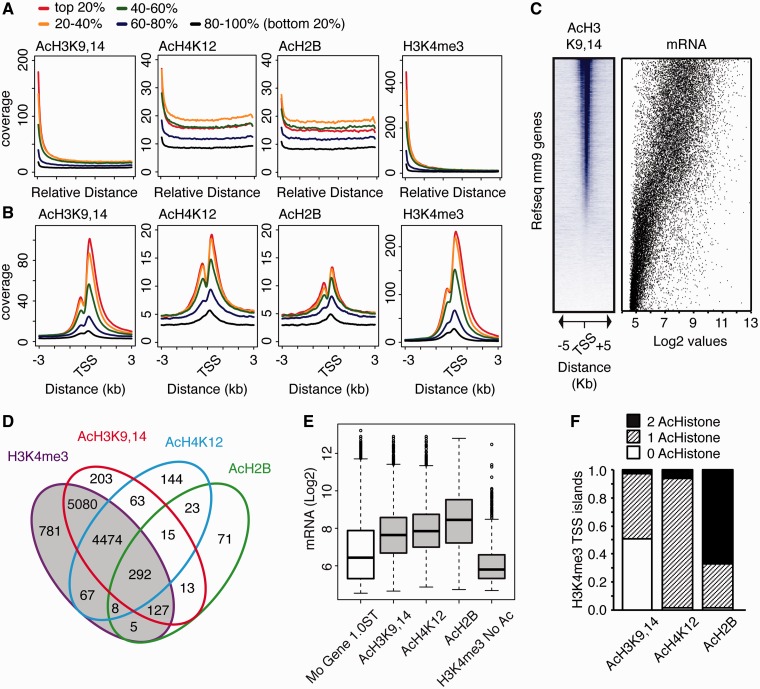
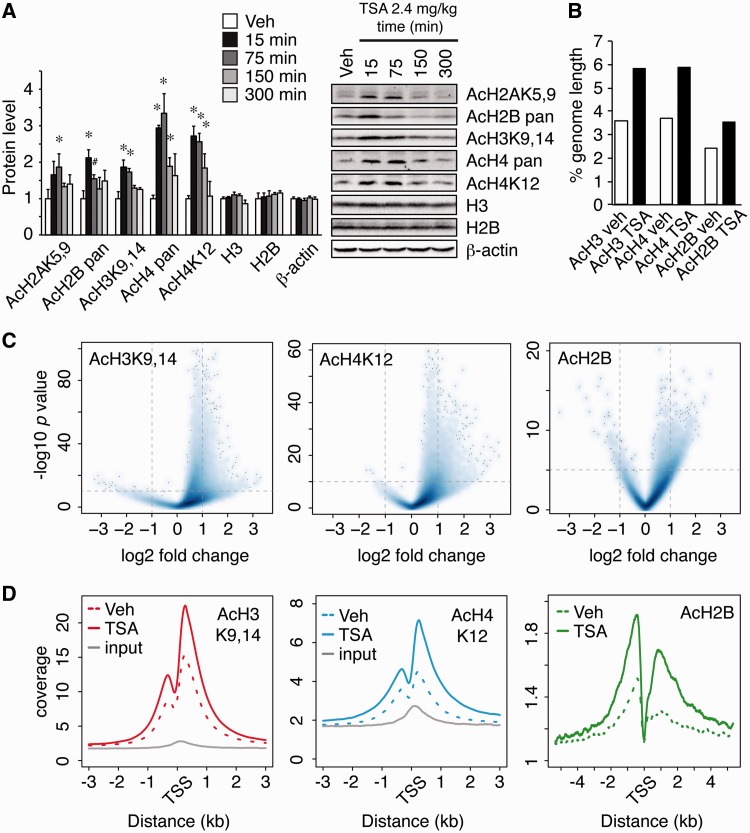
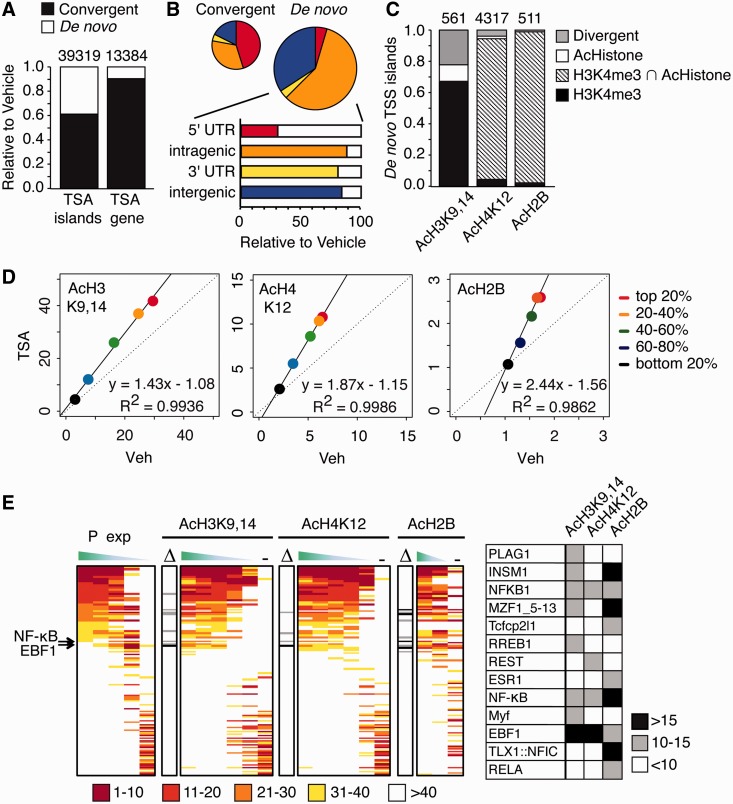
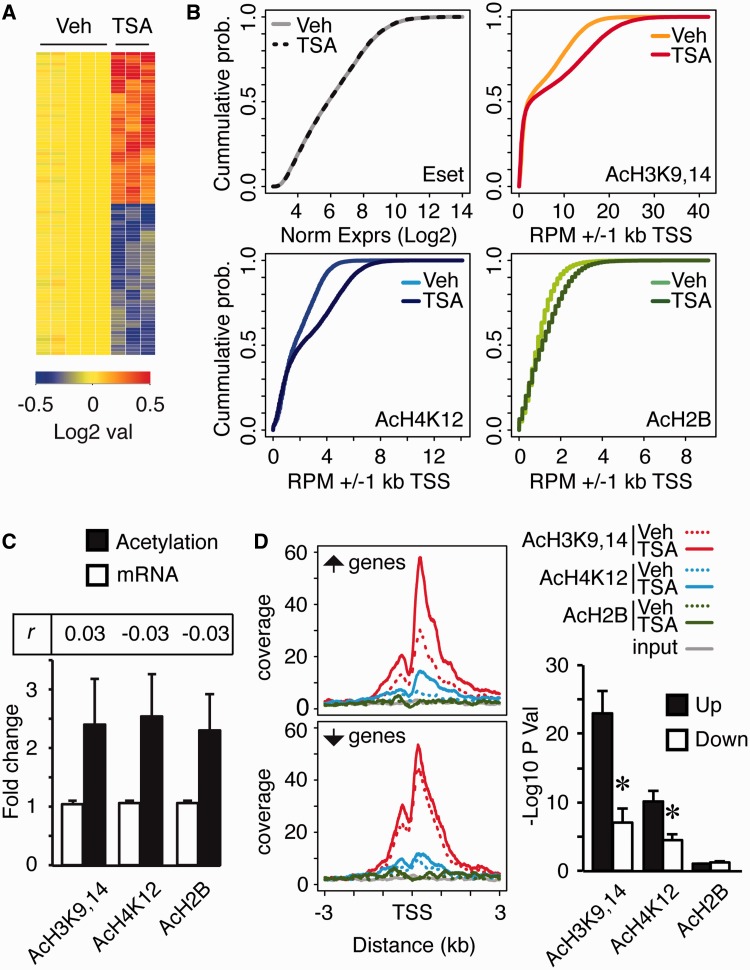
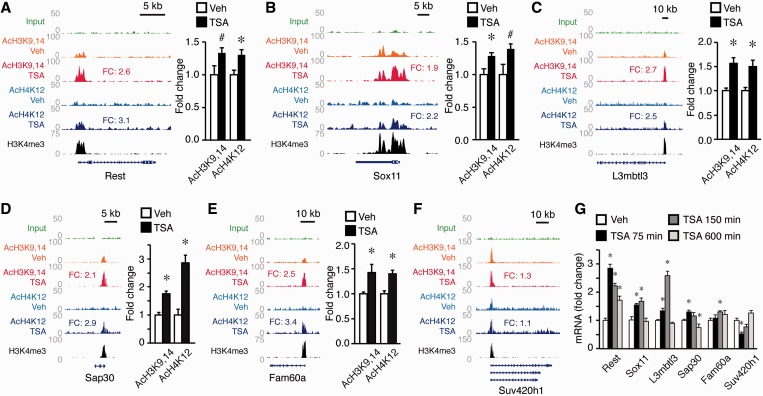
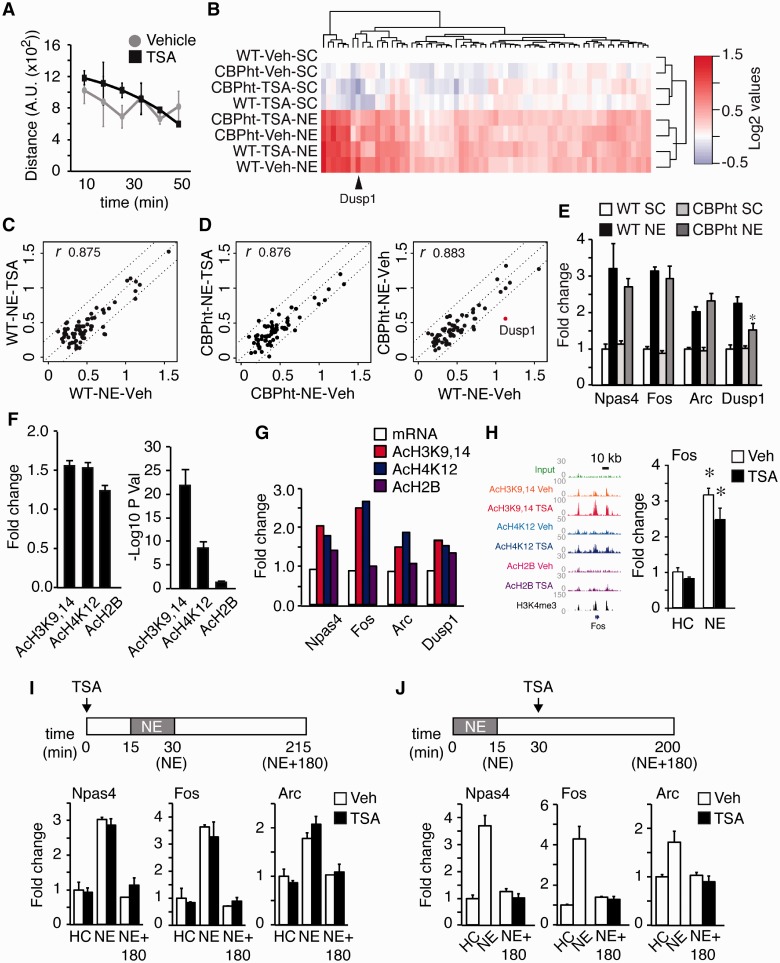
Histone deacetylase inhibitors (HDACis) have been shown to potentiate hippocampal-dependent memory and synaptic plasticity and to ameliorate cognitive deficits and degeneration in animal models for different neuropsychiatric conditions. However, the impact of these drugs on hippocampal histone acetylation and gene expression profiles at the genomic level, and the molecular mechanisms that underlie their specificity and beneficial effects in neural tissue, remains obscure. Here, we mapped four relevant histone marks (H3K4me3, AcH3K9,14, AcH4K12 and pan-AcH2B) in hippocampal chromatin and investigated at the whole-genome level the impact of HDAC inhibition on acetylation profiles and basal and activity-driven gene expression. HDAC inhibition caused a dramatic histone hyperacetylation that was largely restricted to active loci pre-marked with H3K4me3 and AcH3K9,14. In addition, the comparison of Chromatin immunoprecipitation sequencing and gene expression profiles indicated that Trichostatin A-induced histone hyperacetylation, like histone hypoacetylation induced by histone acetyltransferase deficiency, had a modest impact on hippocampal gene expression and did not affect the transient transcriptional response to novelty exposure. However, HDAC inhibition caused the rapid induction of a homeostatic gene program related to chromatin deacetylation. These results illuminate both the relationship between hippocampal gene expression and histone acetylation and the mechanism of action of these important neuropsychiatric drugs.


Figures

Figure 1.
Figure 1.
Histone acetylation marks are enriched in gene and enhancer sequences. (A) Density heatmap showing the coverage for each epigenetic mark across 10 kb centered at the TSS of each RefSeq gene. Individual sequences were binned in 25 bp windows (400 bins per sequence), and coverage was computed and plotted as a relative color intensity scale. In all representations, RefSeq genes were ranked according to their H3K4me3 levels. (B) Pie charts present the distribution of H3K4me3, AcH3K9,14, AcH4K12 and AcH2B islands among different gene features: 5′UTR, overlapping with TSS (including islands comprising the whole gene); 3′UTR, overlapping with gene end; intragenic, inside exons or introns excluding the islands that overlapped with the 5 or 3-end of the gene; intergenic, upstream and downstream of genes. (C) Median width of H3K4me3, AcH3K9,14, AcH4K12 and AcH2B islands. (D) Mean enrichment profiles presenting the genomic distribution of reads for H3K4me3, AcH3K9,14, AcH4K12 and AcH2B along putative neuronal CBP enhancers (left) and brain-specific p300-bound sites (right). (E) Relative coverage of TSSs and enhancers by the different epigenetic marks.
Figure 2.
Figure 2.
Histone acetylation is associated with active transcription. (A) Distribution of reads along gene length for the four epigenetic marks. Genes were ranked according to relative mRNA expression levels and split into five equal sets. (B) Mean enrichment profiles similar to those in A, but around all annotated TSSs. (C). AcH3K9,14 density heatmap for all RefSeqs (ranked according to their AcH3K9,14 levels around the TSSs) is presented along with relative mRNA values (scatter plot). (D) Overlap between TSSs harboring islands for H3K4me3, AcH3K9,14, AcH4K12 and AcH2B. (E) Boxplot showing the relative mRNA expression values for genes harboring an H3K4me3 island at their TSS either alone (H3K4me3 No Ac) or in combination with any of the acetylation marks (AcH3K9,14, AcH4K12 and AcH2B). Boxes correspond to the intersection between each hyperacetylation mark and H3K4me3 (gray colored area) shown in (D). The distribution of expression values for the whole array (Mo Gene 1.0ST) is also shown. (F) Ratio of TSSs with an H3K4me3 island that contain one or more acetylation marks.
Figure 3.
Figure 3.
TSA targets transcriptionally active genes. (A) Densitometric quantification of western blot data (left) and representative western blot images (right) of hippocampal bulk histone acetylation levels at different time points after TSA or vehicle (Veh) injection. *P < 0.05, Student’s t-test versus vehicle; n = 4–5 per group. Data are expressed as mean ± S.E.M. (B) Percentage of effective genome length showing enrichment in AcH3K9,14, AcH4K12 and AcH2B in the basal condition (Veh) and on TSA administration (TSA). (C) Volcano plots for AcH3K9,14, AcH4K12 and AcH2B showing the magnitude of differential enrichment (log2 FC) versus statistical significance (−log10 P-value) for each individual island detected in the comparison of vehicle- and TSA-treated mice. (D) Mean enrichment pattern for AcH3K9,14, AcH4K12 and AcH2B were profiled across all annotated TSSs for vehicle (dotted lines) and TSA treated mice (solid lines). Solid gray lines in AcH3K9,14 and AcH4K12 graphs show coverage in input condition.
Figure 4.
Figure 4.
The presence of H3K4me3 and AcH3K9,14 drives TSA-induced chromatin hyperacetylation. (A) Bar graph shows the percentage of AcH3K9,14 islands (left bar) and annotated genes associated with those islands (right bar) in the TSA condition that are present in the vehicle condition (convergent; black) or generated de novo (de novo; white). (B) Pie charts show the annotation of AcH3K9,14 islands in TSA samples relative to their nearest gene, distinguishing between islands already present in basal condition (convergent) and those that were unique to TSA samples (de novo). The lower bar chart depicts the percentages of de novo islands according to their relative position to the nearest TSS. (C) Ratio of de novo islands for each acetylation mark that mapped to genes associated to H3K4me3 in the vehicle condition, to genes that bore both H3K4me3 and a histone acetylation mark, to genes that only had acetylation marks and those completely new (divergent). (D) Scatter plot shows mean coverage around TSSs in vehicle condition (Veh) versus TSA-treated mice (TSA). To generate the graph, sequence tags were determined at the TSS of all RefSeq (+/−1 Kb), RefSeqs were ranked according to relative mRNA expression levels and then split into five equal sets. Solid black lines in the plots denote the linear regression line. (E) Pscan software (159.149.160.51/pscan/) was used to scan for TFBSs in the promoter regions (−950/+50) of gene sets classified according to different parameters. First, genes were ranked according to their expression level in hippocampus (P exp) in five equal-size groups (from top 20% -left- to bottom 20% -right). In parallel, we also present the TFBS enrichment in the promoter regions of gene sets classified according to their acetylation changes at the TSS in response to TSA for the three acetylation marks (five equal-size groups for AcH3 and AcH4 ranked from left to right according to FDR P-values, and two equal-size groups for AcH2B ranked according to E-values; we also included an additional group (−) in each case composed with an equal-size set of randomly selected genes without any detected island for the corresponding mark). JASPAR TFBS were ranked according to Z-score values for each one of these groups. Significant enrichments (P < 0.05) were generally observed only for TFBS ranked above 40, rank values >40 were ignored. TFBS were ordered according to the top 20% expression group rank. To identify TFBS associated with TSA-dependent acetylation, we calculated the difference in rank values (Δ) between the top 20% expressed genes and the top group of differentially acetylated islands (group 1) for each histone mark. Only TFBSs with Δ > 10 in the comparison of the rank position between the top 20% group in TSA-mediated hyperacetylation for each mark and top 20% expression group are indicated.
Figure 5.
Figure 5.
TSA causes the uncoupling between gene transcription and histone acetylation. (A) Heatmap showing the 88 Transcript Cluster IDs differentially expressed after TSA administration (adj. P < 0.05, FC > 1.2). (B) Cumulative probability distribution of expression levels (log2 values) (upper left) and normalized reads across the TSSs for AcH3K9,14 (upper right), AcH4K12 (bottom left) and AcH2B (bottom right) upon vehicle or TSA administration. The difference between vehicle and TSA treatment was statistically significant in the case of AcH3K9,14, AcH4K12 and AcH2B (P < 0.001, Kolmogorov–Smirnov test) but not for expression levels. (C) Bar chart shows the average FC of TSA-mediated histone acetylation changes (black bars) and transcript level changes (white bars) for the group of genes that exhibited a stronger hyperacetylation response to the drug (AcH3K9,14 and AcH4K12: FC > 2, FDR P < 10−10; AcH2B: FC > 2, FDR P < 10−5). Pearson correlation coefficients for each correlation are also shown (see full chart in Supplementary Figure S8B). Data are represented as mean ± SD. (D) Left: mean enrichment pattern for AcH3K9,14 (red), AcH4K12 (blue) and AcH2B (green) were profiled across upregulated and downregulated genes after TSA (solid lines) or vehicle (dotted lines) administration. Solid gray lines show coverage in the input condition. Right: bar chart depicts the P-value for histone acetylation changes occurring at upregulated or downregulated genes after TSA treatment (see also the correlation graphs in Supplementary Figure S8C). *P < 0.05 (Student’s t-test). Data are expressed as mean ± S.E.M.
Figure 6.
Figure 6.
TSA induces genes involved in chromatin deacetylation. (A–E) Left: ChIPseq data at the Rest, Sox11, L3mbtl3, Sap30 and Fam60a loci. Horizontal rows display the number of normalized reads across the loci, with ‘Veh’ and ‘TSA’ denoting the treatment condition. Enrichment increases after TSA are indicated as FC. Right: Confirmation of hyperacetylation data through independent ChIP assay using oligo pairs that amplify a genomic sequence contained into the island detected by ChIPseq. Data are represented as mean ± S.E.M. *P < 0.05; #P < 0.1 (Student’s t-test), n = 4 per group. (F) ChIPseq data at Suv420h1 locus. (G) Time course and biological validation of candidate genes by RT-qPCR analysis. *P < 0.05 (Student’s t-test), n = 4–5 per group.
Figure 7.
Figure 7.
TSA-induced hyperacetylation does not alter the transcriptional response to novelty. (A) TSA administration did not affect the exploration of a novel environment. (B) Heatmap showing the hierarchical clustering of transcriptional changes in response to novelty exposure of wild-type and CBP-deficient mice treated with vehicle or TSA. (C) Scatter plot showing the FC (log2) of differentially expressed transcripts on NE in WT mice treated with TSA or vehicle. Pearson correlation coefficient is shown. (D) Scatter plots showing the FC (log2) of differentially expressed transcripts on NE in CBP-deficient mice treated with TSA or vehicle (left) and comparing the induction of novelty genes in WT and Cbp+/ mice (right). The red dots represent the genes showing significant interaction between housing and genotype (non-corrected P-values). Pearson correlation coefficients are shown. (E) RT-qPCR array validation for Fos, Arc, Npas4 and Dusp1. Two-way ANOVA revealed a significant novelty effect for the four genes (P < 0.001), but only Dusp1 induction [also affected in CBP cKO mice (28)] exhibited a significant genotype effect (P = 0.04) and genotype x housing interaction (P = 0.04). n = 3 mice per group. (F) Bar chart depicts the average FC (left) and P-values (right) of histone acetylation changes occurring in NE-induced genes after TSA administration. (G) Summary of ChipSeq and array data for the IEGs Fos, Dusp1, Arc and Npas4. (H) ChIPseq data and RT-qPCR validation of gene induction at the Fos locus. * P < 0.05 (Student’s t-test), n = 3–4 per group. (I) Hippocampal mRNA expression of IEGs Npas4, Fos and Arc in mice that were injected with vehicle (Veh) or TSA (TSA) and 15 min later exposed to NE for 15 min. n = 3–4 except for control NE+180 min. (J) Hippocampal mRNA expression of IEGs Npas4, Fos and Arc in mice that were exposed to NE for 15 min and 15 min later injected vehicle (Veh) or TSA (TSA). n = 3–4. In all cases, data are expressed as mean ± S.E.M.

Similar articles

Cited by

References

    1. Strahl BD, Allis CD. The language of covalent histone modifications. Nature. 2000;403:41–45. - PubMed
    1. Kouzarides T. Chromatin modifications and their function. Cell. 2007;128:693–705. - PubMed
    1. Alarcon JM, Malleret G, Touzani K, Vronskaya S, Ishii S, Kandel ER, Barco A. Chromatin acetylation, memory, and LTP are impaired in CBP+/− mice: a model for the cognitive deficit in Rubinstein-Taybi syndrome and its amelioration. Neuron. 2004;42:947–959. - PubMed
    1. Korzus E, Rosenfeld MG, Mayford M. CBP histone acetyltransferase activity is a critical component of memory consolidation. Neuron. 2004;42:961–972. - PMC - PubMed
    1. Lopez-Atalaya JP, Gervasini C, Mottadelli F, Spena S, Piccione M, Scarano G, Selicorni A, Barco A, Larizza L. Histone acetylation deficits in lymphoblastoid cell lines from patients with Rubinstein-Taybi syndrome. J. Med. Genet. 2012;49:66–74. - PubMed

Publication types