. 2013 Aug;18(5):455-66.
doi: 10.3109/1354750X.2013.814073. Epub 2013 Jul 3.

MicroRNA in Alzheimer's disease: an exploratory study in brain, cerebrospinal fluid and plasma

Affiliations

MicroRNA in Alzheimer's disease: an exploratory study in brain, cerebrospinal fluid and plasma

Lynn M Bekris et al. Biomarkers. 2013 Aug.

Abstract

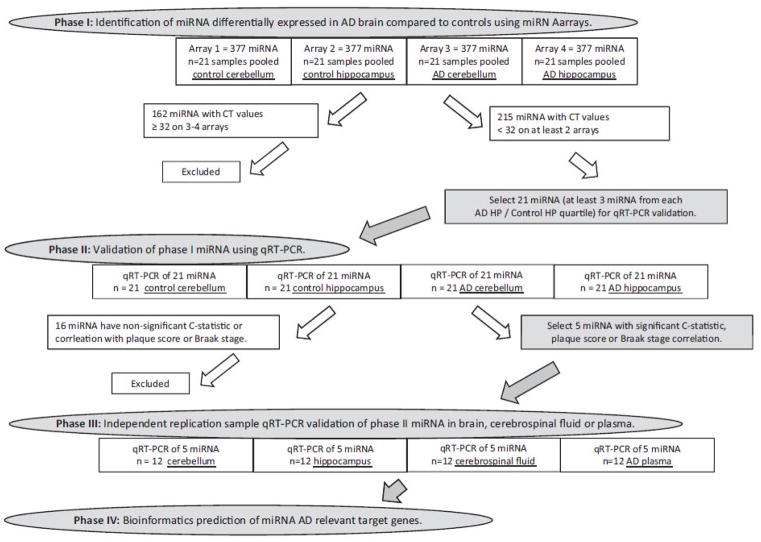
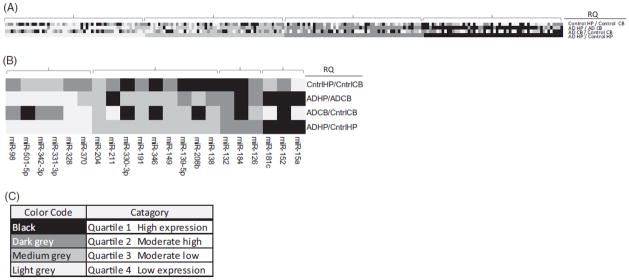
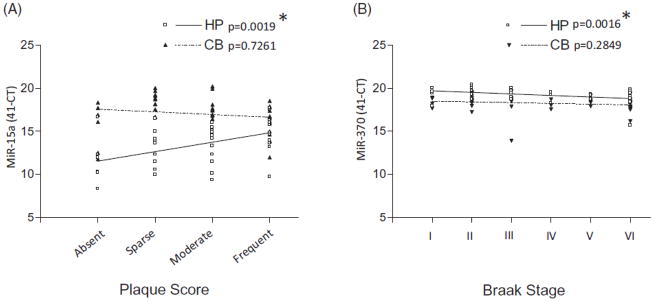
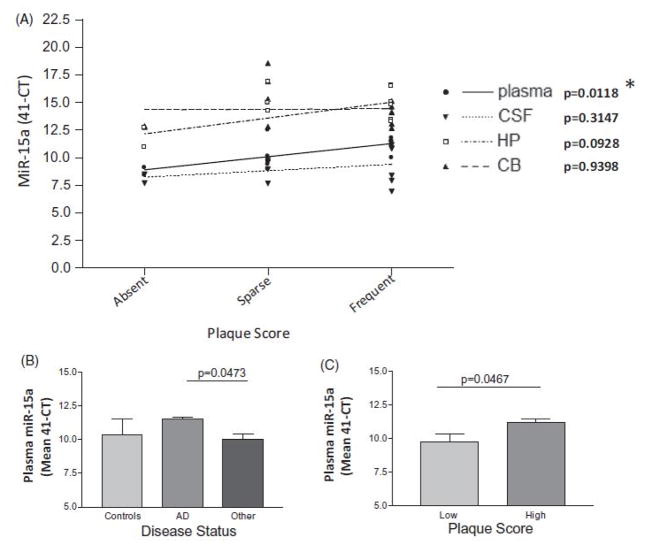
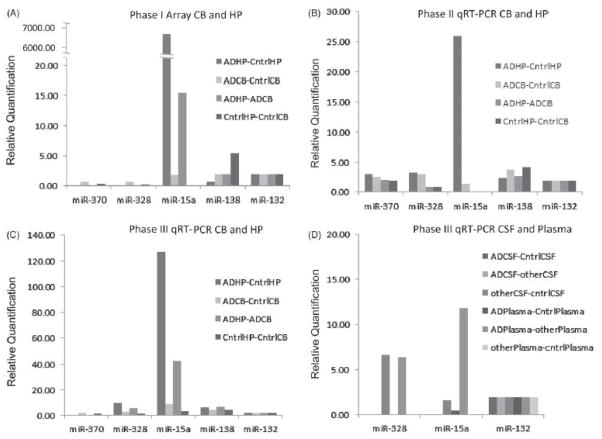
MicroRNA (miRNA) may be potential biomarkers of Alzheimer's disease (AD). The objective of this investigation was to demonstrate that miRNAs in human brain or biofluids are differentially expressed according to disease status, tissue type, neuritic plaque score or Braak stage. Post-mortem brain (PMB) miRNA were profiled using arrays and validated using quantitative RT-PCR (qRT-PCR). Five qRT-PCR-validated miRNAs were measured in an independent sample of PMB, cerebrospinal fluid and plasma from the same subjects. Plasma miR-15a was found to be associated with plaque score in the independent sample. In conclusion, miRNA present in human biofluids may offer utility as biomarkers of AD.


Conflict of interest statement

Declaration of interest: The authors report no declarations of interest

Figures

Figure 1
Figure 1
Study design flow chart
Figure 2
Figure 2
Phase I microRNA array heat maps. Panel A: heat map for relative quantification (RQ: RQ=(41-CT array 1)/(41-CT array 2)). RQ values are color coded according to quartiles for each RQ category (n=215 miRNA) and are arranged according to RQ AD HP/Control HP quartiles (brackets). Panel B: heat map shows n=21 selected candidate miRNA. At least three candidate miRNA from each AD HP/control HP RQ quartile were randomly selected for phase II validation (Panel B). Panel C: color codes for each quartile.
Figure 3
Figure 3
Phase II hippocampus (HP) or cerebellum (CB) miRNA qRT-PCR level correlation with neuritic plaque score or Braak stage. Of five miRNAs (miR-370, miR-328, miR-138, miR-132 and miR-15a) that had significant sensitivity, specificity or correlation with disease status, plaque score or Braak stage, two (miR-15a and miR-370) were significantly correlated with either plaque score (HP miR-15a, linear regression p value, 0.0019, Spearman correlation p value, 0.0028, Panel A) or Braak stage (HP miR-370, linear regression p value, 0.0016, Spearman correlation p value, 0.0021, Panel B). *Remains significant after Bonferroni correction for multiple comparisons.
Figure 4
Figure 4
Phase III CB, HP, CSF and plasma miR-15a levels in controls, AD and other neurodegenerative diseases (n=12). Plasma miR-15a levels significantly positively correlate with plaque score (linear regression p value, 0.0118, Spearman correlation p value, 0.0294) (Panel A). There is a difference in plasma miR-15a levels between; AD and other neurodegenerative disease (p value, 0.0473) (Panel B). Significance does not remain after taking into account multiple comparisons. There is a significant difference in plasma miR-15a levels between low and high plaque score subjects (p value, 0.0467) (Panel C). *Remains significant after Bonferroni correction for multiple comparisons.
Figure 5
Figure 5
Relative quantification results for 5 miRNA from the pooled arrays of phase I, qRT-PCR phase II and qRT-PCR phase III. Data were normalized to miR-132, which was present in all tissues; cerebellum (CB), hippocampus (HP), cerebrospinal fluid (CSF) and plasma. Data are presented as a relative quantification (RQ)¼2 –DDCT, which represents the fold difference between tissue type. There is a large fold difference between AD HP and control HP for miR-15a for the phase I pooled array assay (Panel A), the phase II validation qRT-PCR assay (Panel B) and for the phase III independent replication sample qRT-PCR (Panel C). Phase III qRT-PCR of the 3 miRNA detected in CSF and plasma shows miR-15a fold difference as greatest between AD plasma and other neurodegenerative disease plasma (Panel D).

References

    1. Consensus recommendations for the postmortem diagnosis of Alzheimer’s disease. The National Institute on Aging, and Reagan Institute Working Group on Diagnostic Criteria for the Neuropathological Assessment of Alzheimer’s Disease. Neurobiol Aging. 1997;18:S1–2. - PubMed
    1. Abner EL, Kryscio RJ, Schmitt FA, et al. “End-stage” neurofibrillary tangle pathology in preclinical Alzheimer’s disease: fact or fiction? J Alzheimers Dis. 2011;25:445–53. - PMC - PubMed
    1. Adilakshmi T, Sudol I, Tapinos N. Combinatorial action of miRNAs regulates transcriptional and post-transcriptional gene silencing following in vivo PNS injury. PLoS One. 2012;7:e39674. (1–14) - PMC - PubMed
    1. Aqeilan RI, Calin GA, Croce CM. miR-15a and miR-16-1 in cancer: discovery, function and future perspectives. Cell Death Differ. 2010;17:215–20. - PubMed
    1. Betel D, Koppal A, Agius P, et al. Comprehensive modeling of microRNA targets predicts functional non-conserved and noncanonical sites. Genome Biol. 2010;11:R90. (1–14) - PMC - PubMed

Publication types

MeSH terms