

Cellular Composition of Cerebrospinal Fluid in HIV-1 Infected and Uninfected Subjects
- PMID: 23822975
- PMCID: PMC3688831
- DOI: 10.1371/journal.pone.0066188
Cellular Composition of Cerebrospinal Fluid in HIV-1 Infected and Uninfected Subjects
Abstract
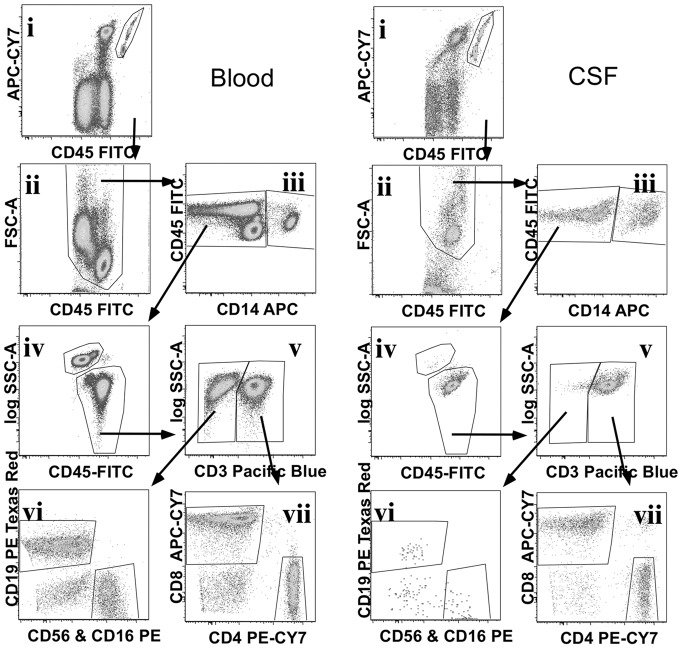
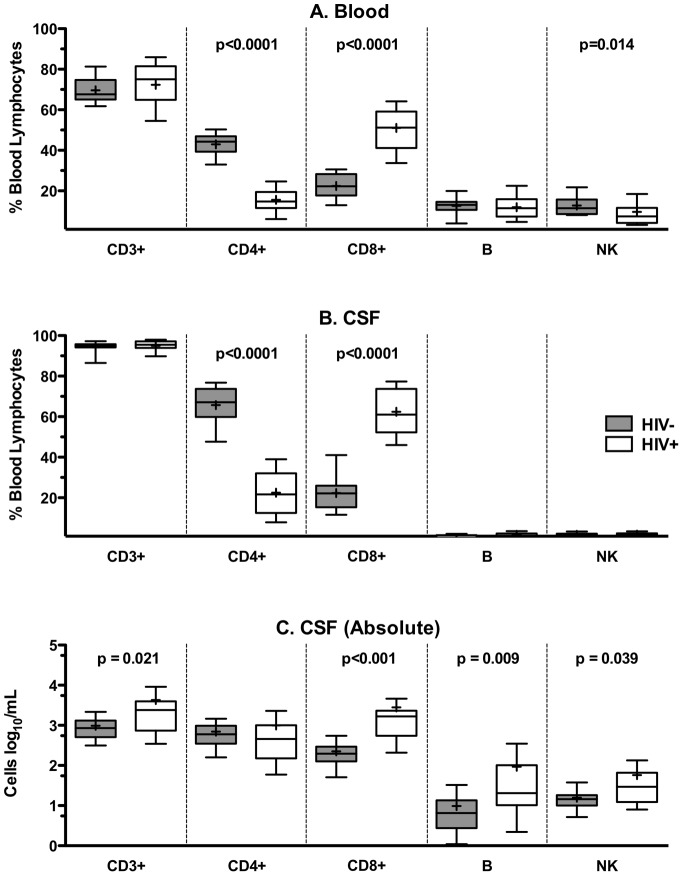
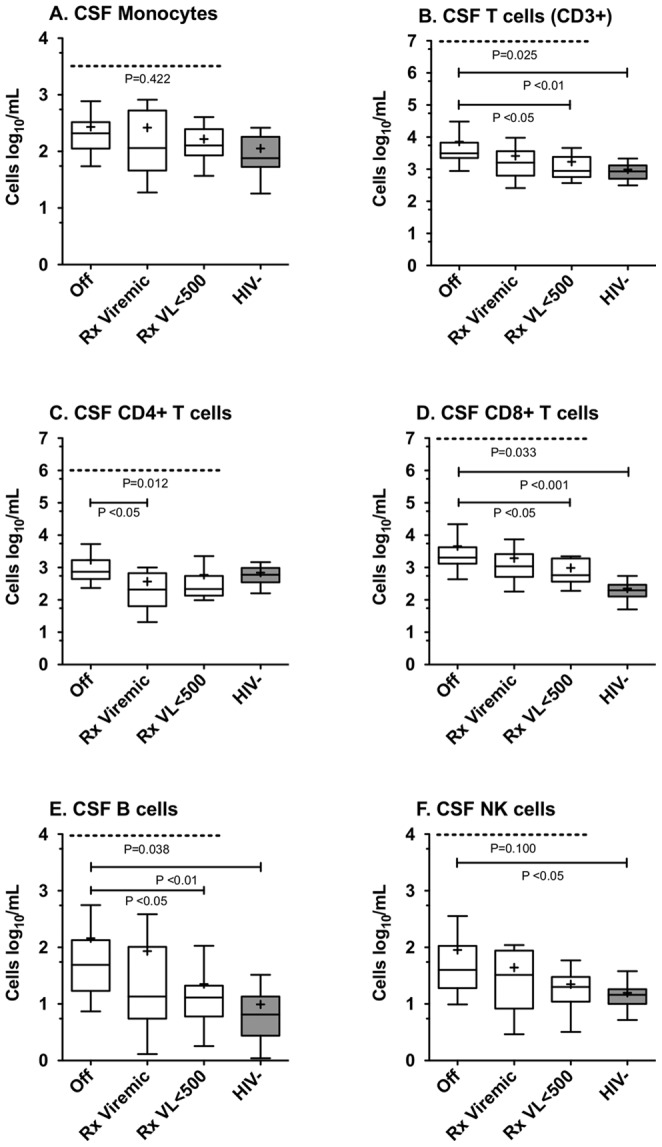
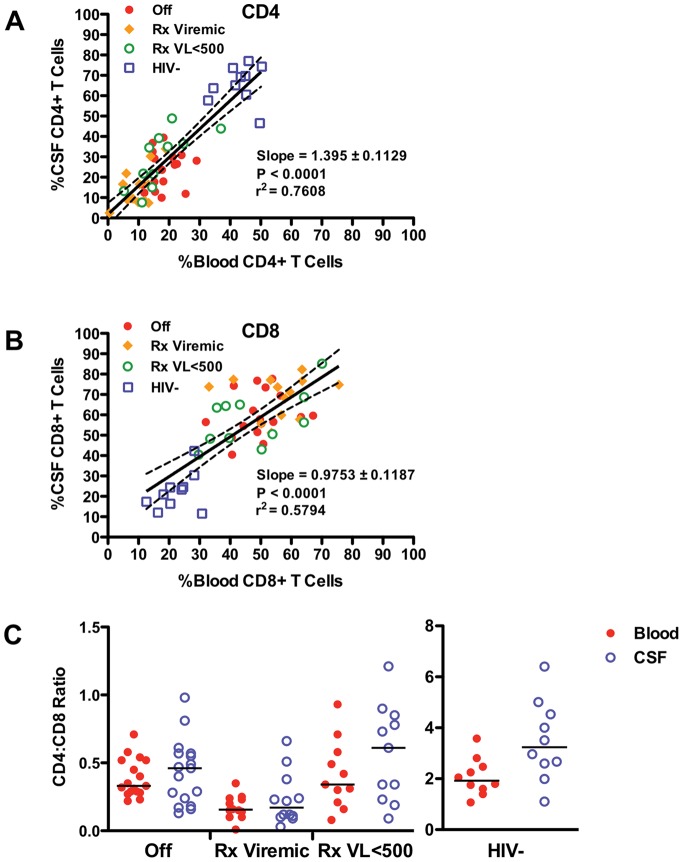
In order to characterize the cellular composition of cerebrospinal fluid (CSF) in a healthy state and in the setting of chronic pleocytosis associated with HIV-1 (HIV) infection, multi-parameter flow cytometry was used to identify and quantitate cellular phenotypes in CSF derived from HIV-uninfected healthy controls and HIV-infected subjects across a spectrum of disease and treatment. CD4+ T cells were the most frequent CSF population and the CD4:CD8 ratio was significantly increased in the CSF compared to blood (p = 0.0232), suggesting preferential trafficking of CD4+ over CD8+ T cells to this compartment. In contrast, in HIV-infection, CD8+ T cells were the major cellular component of the CSF and were markedly increased compared to HIV-uninfected subjects (p<0.001). As with peripheral blood, the CSF CD4:CD8 ratio was reversed in HIV-infected subjects compared to HIV-uninfected subjects. Monocytes, B cells and NK cells were rare in the CSF in both groups, although absolute counts of CSF NK cells and B cells were significantly increased in HIV-infected subjects (p<0.05). Our studies show that T cells are the major cellular component of the CSF in HIV-infected and uninfected subjects. The CSF pleocytosis characteristic of HIV infection involves all lymphocyte subsets we measured, except for CD4+ T cells, but is comprised primarily of CD8+ T cells. The reduced proportion of CD4+ T cells in the CSF may reflect both HIV-related peripheral loss and changes in trafficking patterns in response to HIV infection in the central nervous system.
Conflict of interest statement
Figures
Similar articles
-
T-cell activation and memory phenotypes in cerebrospinal fluid during HIV infection.J Acquir Immune Defic Syndr. 2005 May 1;39(1):16-22. doi: 10.1097/01.qai.0000155036.03004.a0. J Acquir Immune Defic Syndr. 2005. PMID: 15851909
-
Antiretroviral treatment effect on immune activation reduces cerebrospinal fluid HIV-1 infection.J Acquir Immune Defic Syndr. 2008 Apr 15;47(5):544-52. doi: 10.1097/QAI.0b013e318162754f. J Acquir Immune Defic Syndr. 2008. PMID: 18362693 Free PMC article.
-
Cytoimmunological abnormalities in cerebrospinal fluid in early stages of HIV-1 infection often precede changes in blood.J Neuroimmunol. 1993 May;44(2):199-204. doi: 10.1016/0165-5728(93)90043-x. J Neuroimmunol. 1993. PMID: 8505408
-
Increased adhesion molecule and chemokine receptor expression on CD8+ T cells trafficking to cerebrospinal fluid in HIV-1 infection.J Infect Dis. 2004 Jun 15;189(12):2202-12. doi: 10.1086/421244. Epub 2004 May 24. J Infect Dis. 2004. PMID: 15181567
-
CD8 T-cell subsets and viral load in the cerebrospinal fluid of therapy-naive HIV-infected individuals.AIDS. 2007 Jan 11;21(2):250-3. doi: 10.1097/QAD.0b013e328011ec76. AIDS. 2007. PMID: 17197822
Cited by
-
The impact of substance abuse on HIV-mediated neuropathogenesis in the current ART era.Brain Res. 2019 Dec 1;1724:146426. doi: 10.1016/j.brainres.2019.146426. Epub 2019 Aug 29. Brain Res. 2019. PMID: 31473221 Free PMC article. Review.
-
Distinct cellular immune properties in cerebrospinal fluid are associated with cognition in HIV-infected individuals initiating antiretroviral therapy.J Neuroimmunol. 2020 Jul 15;344:577246. doi: 10.1016/j.jneuroim.2020.577246. Epub 2020 Apr 27. J Neuroimmunol. 2020. PMID: 32371201 Free PMC article.
-
The immunopathogenesis of cryptococcal immune reconstitution inflammatory syndrome: understanding a conundrum.Curr Opin Infect Dis. 2016 Feb;29(1):10-22. doi: 10.1097/QCO.0000000000000224. Curr Opin Infect Dis. 2016. PMID: 26658650 Free PMC article. Review.
-
Examination and characterisation of the effect of amitriptyline therapy for chronic neuropathic pain on neuropeptide and proteomic constituents of human cerebrospinal fluid.Brain Behav Immun Health. 2020 Dec 7;10:100184. doi: 10.1016/j.bbih.2020.100184. eCollection 2021 Jan. Brain Behav Immun Health. 2020. PMID: 34589721 Free PMC article.
-
T-cell activation state differentially contributes to neuropsychiatric complications in women with HIV.Brain Behav Immun Health. 2022 Aug 29;25:100498. doi: 10.1016/j.bbih.2022.100498. eCollection 2022 Nov. Brain Behav Immun Health. 2022. PMID: 36097532 Free PMC article.
References
-
- Spudich S, Lollo N, Liegler T, Deeks SG, Price RW (2006) Treatment benefit on cerebrospinal fluid HIV-1 levels in the setting of systemic virological suppression and failure. J Infect Dis 194: 1686–1696. - PubMed
-
- McArthur JH, Palenicek JG, Bowersox LL (1988) Human immunodeficiency virus and the nervous system. Nurs Clin North Am 23: 823–841. - PubMed
-
- Marshall D, Brey R, Cahill W, Houk R, Zajac R, et al. (1988) Spectrum of cerebrospinal fluid findings in various stages of human immunodeficiency virus infection. Arch Neurol 45: 954–958. - PubMed
-
- Ellis RJ, Hsia K, Spector SA, Nelson JA, Heaton RK, et al. (1997) Cerebrospinal fluid human immunodeficiency virus type 1 RNA levels are elevated in neurocognitively impaired individuals with acquired immunodeficiency syndrome. HIV Neurobehavioral Research Center Group. Ann Neurol 42: 679–688. - PubMed
-
- Garcia F, Plana M, Vidal C, Cruceta A, O'Brien WA, et al. (1999) Dynamics of viral load rebound and immunological changes after stopping effective antiretroviral therapy. Aids 13: F79–86. - PubMed
Publication types
MeSH terms
Grants and funding
LinkOut - more resources
Full Text Sources
Other Literature Sources
Medical
Research Materials
