. 2013 Aug 29;218(3):339-48.
doi: 10.1530/JOE-13-0135. Print 2013 Sep.

Involvement of exercise-induced macrophage migration inhibitory factor in the prevention of fatty liver disease

Affiliations

Involvement of exercise-induced macrophage migration inhibitory factor in the prevention of fatty liver disease

Hyo Youl Moon et al. J Endocrinol. .

Abstract

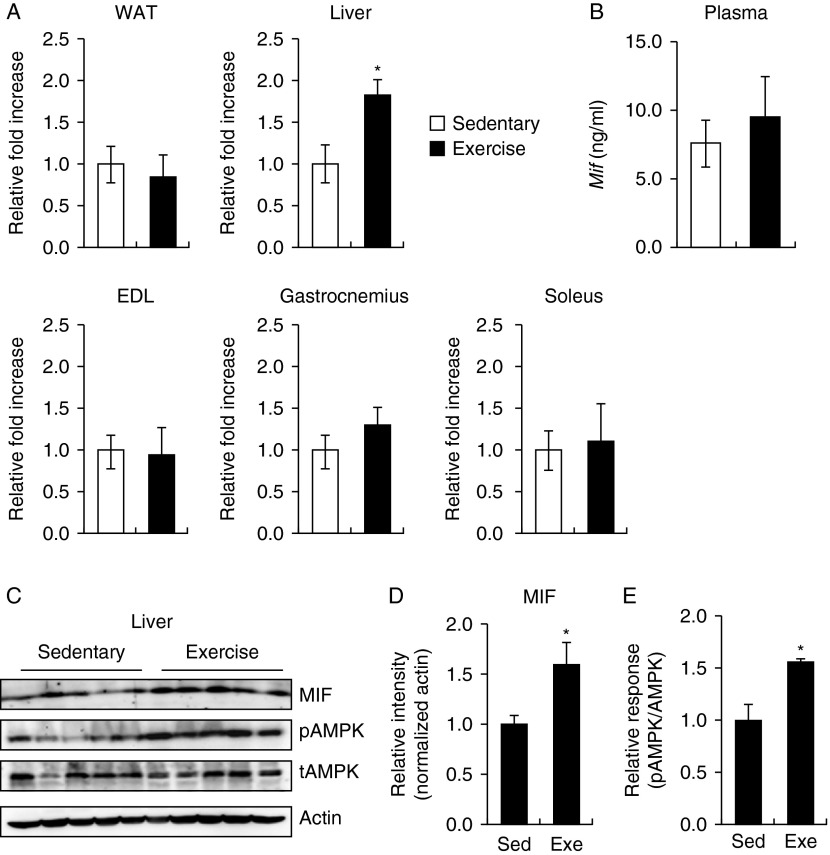
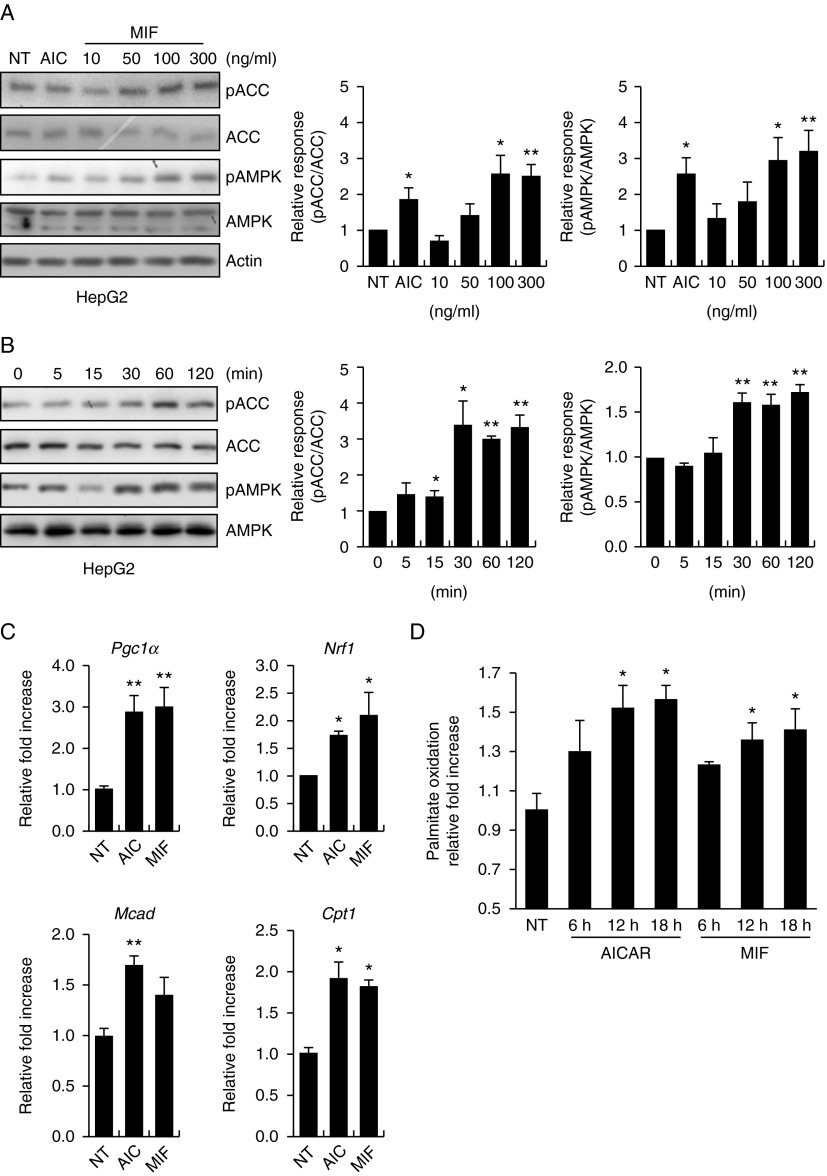
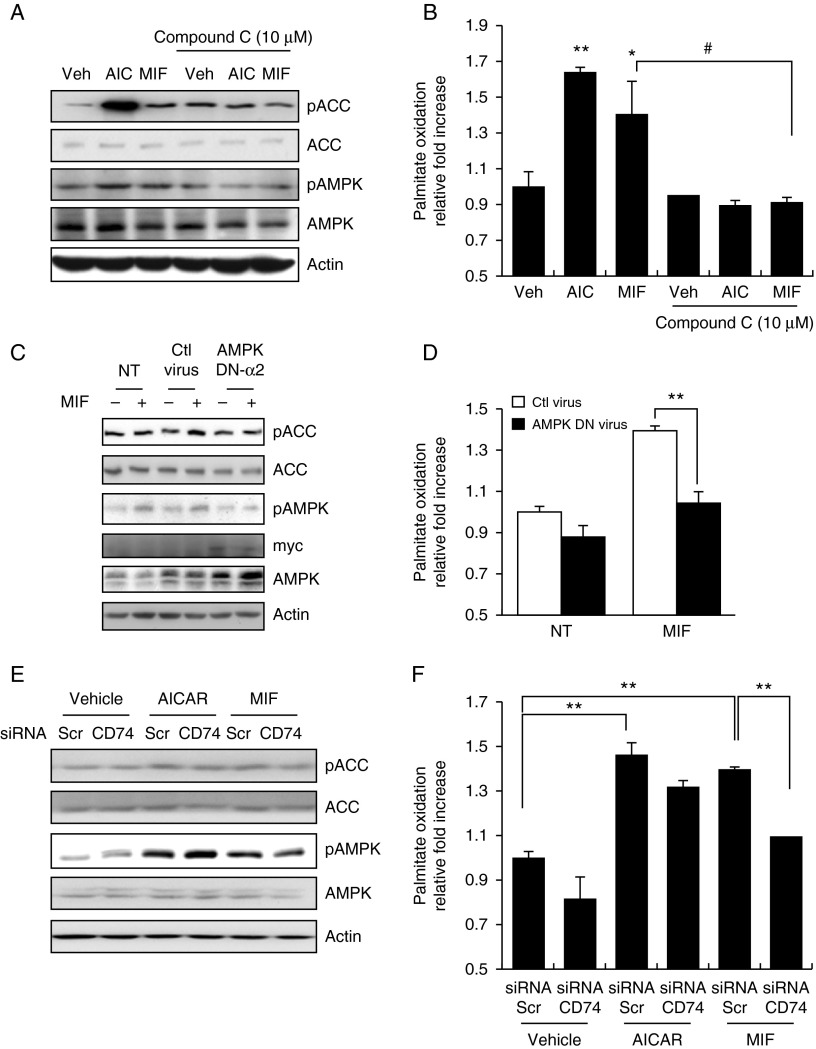
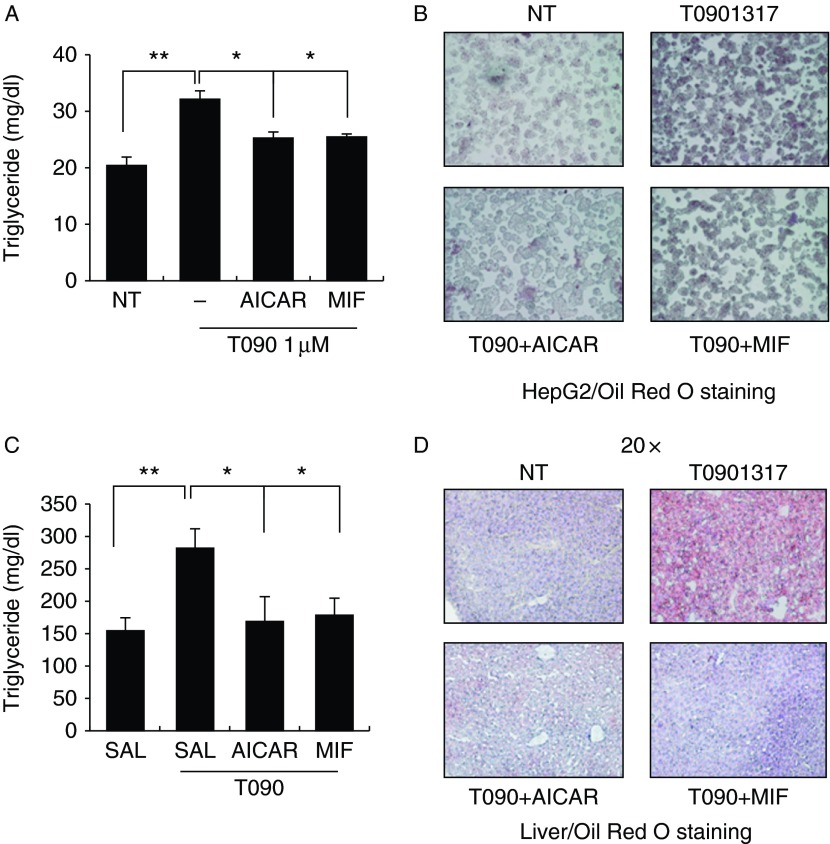
Physical inactivity can lead to obesity and fat accumulation in various tissues. Critical complications of obesity include type II diabetes and nonalcoholic fatty liver disease (NAFLD). Exercise has been reported to have ameliorating effects on obesity and NAFLD. However, the underlying mechanism is not fully understood. We showed that liver expression of macrophage migration inhibitory factor (MIF) was increased after 4 weeks of treadmill exercise. Phosphorylation of AMP-activated protein kinase and acetyl-CoA carboxylase in human hepatocyte cell lines was enhanced after MIF treatment. These responses were accompanied by increases in lipid oxidation. Moreover, inhibition of either AMPK or cluster of differentiation 74 resulted in inhibition of MIF-induced lipid oxidation. Furthermore, the administration of MIF to a human hepatocyte cell line and mice liver reduced liver X receptor agonist-induced lipid accumulation. Taken together, these results indicate that MIF is highly expressed in the liver during physical exercise and may prevent hepatic steatosis by activating the AMPK pathway.

Keywords: cytokines; exercise; lipid; liver; molecular biology.


Figures

Figure 1
Figure 1
Expression of MIF in sedentary (Sed) and exercised (Exe) mice. (A) RT-PCR analysis of MIF mRNA in various metabolic tissues. 18s rRNA levels were used as a control. (B) ELISA analysis of plasma MIF levels in mice. (C) Lysates from exercised or sedentary mouse tissues were subjected to western blotting using anti-phospho-AMPK, anti-total AMPK, and anti-MIF antibodies. Anti-β-actin antibodies were used to confirm equal protein loading. (D) Bar graph depicts the mean (±s.e.m.) ratio of intensity of MIF-to-actin bands and phospho-AMPK-to-total AMPK bands. (E) The levels of phosphorylated AMPK in liver were measured after exercise. Data are presented as the mean±s.e.m. (Figures are representative of ten sedentary and nine exercised mouse samples). *P<0.05 vs control values
Figure 2
Figure 2
MIF activates AMPK–ACC, stimulates palmitate oxidation, and increases mitochondria-related gene expression in HepG2 cells. (A) Dose-dependent phosphorylation of AMPK by MIF. HepG2 cells were stimulated with the indicated doses of MIF, AICAR, or vehicle for 1 h. Cell lysates were analyzed by western blotting with anti-phospho-ACC (Ser79) and anti-phospho-AMPK (Thr72) antibodies. Anti-ACC, anti-AMPK, and anti-β-actin antibodies were to check protein loadings. (B) Time-dependent phosphorylation of AMPK by MIF. HepG2 cells were stimulated with MIF (100 ng/μl) for the indicated periods of time. Bar graph depicts the mean (±s.e.m.) ratio of intensity of phospho-ACC-to-total ACC bands and phospho-AMPK-to-total AMPK bands. (C) HepG2 cells were incubated in six-well plates for 24 h with vehicle, MIF (100 ng/μl), or AICAR (100 nM). After 24 h, whole-cell lysates were isolated for analysis of mRNA expression of Pgc1α, Nrf1, Mcad, and Cpt1. (D) HepG2 cells were incubated in 60 mm dishes for 24 h with vehicle, MIF, and AICAR. After washing, cells were assayed for oxidation of [3H]-labeled palmitate, as described in the Materials and methods section. *P<0.05 vs control values (one-way ANOVA). **P<0.01 vs control values. Data are expressed as mean±s.d. of triplicate analyses.
Figure 3
Figure 3
MIF-stimulated palmitate oxidation in a CD74–AMPK-dependent manner. (A) HepG2 cells were pre-treated with compound C (10 μM) for 30 min and were then stimulated with MIF or AICAR for 1 h. Cell lysates were analyzed by western blotting with an anti-phospho-AMPK(Thr72) antibody. (B) Cells were pre-incubated with compound C and then stimulated under the indicated conditions. Oxidation of [3H]-labeled palmitate was measured as described in the Materials and methods section. (C) Cells infected with a mock adenovirus or an adenovirus carrying dominant-negative (DN)-AMPK α2 at an MOI of 30 for 18 h were treated with or without MIF. Cell lysates were analyzed by western blotting. DN-AMPK α2 expression was confirmed using an anti-Myc antibody. (D) Oxidation of [3H]-labeled palmitate was measured after infection with the mock or DN-AMPK a2 adenovirus. (E) HepG2 cells were transfected with CD74 or scrambled siRNA for 48 h and were then stimulated with MIF for 24 h. Whole-cell lysates were used to detect the phosphorylation of AMPK and ACC. (F) HepG2 cells were transfected with CD74 or scrambled siRNA for 48 h and were then stimulated with MIF for 24 h. HepG2 cells were incubated in 60 mm dishes for 24 h with either MIF or AICAR and were then assayed for oxidation of [3H]-labeled palmitate. Data are expressed as means±s.d. of triplicate experiments. *P< 0.05 vs vehicle; **P< 0.01 vs vehicle values and #P< 0.05 vs NT (compound C not treated) values (one-way ANOVA).
Figure 4
Figure 4
Hepatic lipid accumulation was inhibited by MIF treatment. (A) Intracellular TG contents were measured under the indicated conditions. HepG2 cells were exposed to T0901317, a synthetic LXRα ligand, with or without MIF for 24 h. Lipid levels were determined by the TG hydrolysis method. (B) Cells were treated with AICAR or MIF under conditions of T0901317 stimulation. After 24 h, the cells were stained with Oil Red O to observe the accumulation of lipids. Data are expressed as means±s.d. of triplicate experiments. (C) Mice were administrated with vehicle (saline), AICAR, or MIF under conditions of T0901317 (n=4) stimulation. Intracellular TG contents were measured after 5 days of administration. Lipid levels were determined by the TG hydrolysis method. *P<0.05 vs control values, **P<0.01 vs control values. (D) The mice liver of the each experimental group was prepared for cryosection with optimal cutting temperature compound and stained with Oil Red O and hematoxylin to observe the accumulation of lipids. Data are presented as mean±s.e.m.

References

    1. Angulo P. Nonalcoholic fatty liver disease. New England Journal of Medicine. 2002;346:1221–1231. doi: 10.1056/NEJMra011775. - DOI - PubMed
    1. Angulo P. GI epidemiology: nonalcoholic fatty liver disease. Alimentary Pharmacology & Therapeutics. 2007;25:883–889. doi: 10.1111/j.1365-2036.2007.03246.x. - DOI - PubMed
    1. Brown MS, Goldstein JL. The SREBP pathway: regulation of cholesterol metabolism by proteolysis of a membrane-bound transcription factor. Cell. 1997;89:331–340. doi: 10.1016/S0092-8674(00)80213-5. - DOI - PubMed
    1. Browning JD, Horton JD. Molecular mediators of hepatic steatosis and liver injury. Journal of Clinical Investigation. 2004;114:147–152. doi: 10.1172/JCI22422. - DOI - PMC - PubMed
    1. Brownsey RW, Boone AN, Elliott JE, Kulpa JE, Lee WM. Regulation of acetyl-CoA carboxylase. Biochemical Society Transactions. 2006;34:223–227. doi: 10.1042/BST20060223. - DOI - PubMed

Publication types

MeSH terms

Substances