High performance, LED powered, waveguide based total internal reflection microscopy
- PMID: 23823601
- PMCID: PMC3701166
- DOI: 10.1038/srep02133
High performance, LED powered, waveguide based total internal reflection microscopy
Abstract
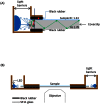
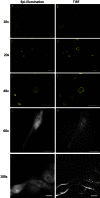
Total internal reflection fluorescence (TIRF) microscopy is a rapidly expanding optical technique with excellent surface sensitivity and limited background fluorescence. Commercially available TIRF systems are either objective based that employ expensive special high numerical aperture (NA) objectives or prism based that restrict integrating other modalities of investigation for structure-function analysis. Both techniques result in uneven illumination of the field of view and require training and experience in optics. Here we describe a novel, inexpensive, LED powered, waveguide based TIRF system that could be used as an add-on module to any standard fluorescence microscope even with low NA objectives. This system requires no alignment, illuminates the entire field evenly, and allows switching between epifluorescence/TIRF/bright field modes without adjustments or objective replacements. The simple design allows integration with other imaging systems, including atomic force microscopy (AFM), for probing complex biological systems at their native nanoscale regimes.
Figures


Similar articles
-
Chip-based wide field-of-view total internal reflection fluorescence microscopy.Opt Lett. 2022 Sep 1;47(17):4303-4306. doi: 10.1364/OL.460496. Opt Lett. 2022. PMID: 36048639
-
Artifact-free objective-type multicolor total internal reflection fluorescence microscopy with light-emitting diode light sources-Part I.J Biophotonics. 2019 Nov;12(11):e201900033. doi: 10.1002/jbio.201900033. Epub 2019 Jul 23. J Biophotonics. 2019. PMID: 31148410
-
Waveguide-based total internal reflection fluorescence microscope enabling cellular imaging under cryogenic conditions.Opt Express. 2021 Oct 11;29(21):34097-34108. doi: 10.1364/OE.433945. Opt Express. 2021. PMID: 34809207
-
The physical basis of total internal reflection fluorescence (TIRF) microscopy and its cellular applications.Methods Mol Biol. 2015;1251:1-23. doi: 10.1007/978-1-4939-2080-8_1. Methods Mol Biol. 2015. PMID: 25391791 Review.
-
Evanescent-wave field imaging: an introduction to total internal reflection fluorescence microscopy.Methods Mol Biol. 2012;823:295-309. doi: 10.1007/978-1-60327-216-2_19. Methods Mol Biol. 2012. PMID: 22081353 Review.
Cited by
-
Fast widefield scan provides tunable and uniform illumination optimizing super-resolution microscopy on large fields.Nat Commun. 2021 May 24;12(1):3077. doi: 10.1038/s41467-021-23405-4. Nat Commun. 2021. PMID: 34031402 Free PMC article.
-
Single-Molecular Förster Resonance Energy Transfer Measurement on Structures and Interactions of Biomolecules.Micromachines (Basel). 2021 Apr 27;12(5):492. doi: 10.3390/mi12050492. Micromachines (Basel). 2021. PMID: 33925350 Free PMC article. Review.
-
Photonic lantern TIRF microscopy for highly efficient, uniform, artifact-free imaging.Opt Express. 2024 Oct 7;32(21):37046-37058. doi: 10.1364/OE.533269. Opt Express. 2024. PMID: 39573578
-
Direct kinetic fingerprinting and digital counting of single protein molecules.Proc Natl Acad Sci U S A. 2020 Sep 15;117(37):22815-22822. doi: 10.1073/pnas.2008312117. Epub 2020 Aug 31. Proc Natl Acad Sci U S A. 2020. PMID: 32868420 Free PMC article.
-
High-angle deflection of metagrating-integrated laser emission for high-contrast microscopy.Light Sci Appl. 2023 Oct 13;12(1):251. doi: 10.1038/s41377-023-01286-0. Light Sci Appl. 2023. PMID: 37833318 Free PMC article.
References
-
- Steyer J. A. & Almers W. A real-time view of life within 100 nm of the plasma membrane. Nat Rev Mol Cell Bio 2, 268–275 (2001). - PubMed
-
- Axelrod D., Thompson N. L. & Burghardt T. P. Total Internal-Reflection Fluorescent Microscopy. J Microsc-Oxford 129, 19–28 (1983). - PubMed
-
- Axelrod D., Burghardt T. P. & Thompson N. L. Total Internal-Reflection Fluorescence. Annu Rev Biophys Bio 13, 247–268 (1984). - PubMed
Publication types
MeSH terms
Grants and funding
LinkOut - more resources
Full Text Sources
Other Literature Sources
Miscellaneous

