. 2013 Nov;84(5):931-9.
doi: 10.1038/ki.2013.193. Epub 2013 Jul 3.

Chronic AT2 receptor activation increases renal ACE2 activity, attenuates AT1 receptor function and blood pressure in obese Zucker rats

Affiliations

Chronic AT2 receptor activation increases renal ACE2 activity, attenuates AT1 receptor function and blood pressure in obese Zucker rats

Quaisar Ali et al. Kidney Int. 2013 Nov.

Abstract

Abnormal regulation of the renin angiotensin system such as enhanced renal AT1R function and reduced ACE2 activity contributes to obesity-related hypertension. Here, we tested whether long-term AT2R activation affects renal function in obesity using lean and obese Zucker rats treated with the AT2R agonist CGP42112A for 2 weeks. This caused blood pressure to decrease by 13 mm Hg, which was associated with increased urinary sodium excretion in the obese rats. Cortical ACE2 expression and activity, the Mas receptor (MasR), and its ligand angiotensin-(1-7) were all increased in CGP-treated obese compared with control rats. Candesartan-induced natriuresis, a measure of AT₁R function, was reduced but cortical AT₁R expression and angiotensin II levels were similar in CGP-treated obese compared with control rats. Renin and AT2R expression in obese rats was not affected by CGP treatment. In HK-2 cells in vitro, CGP treatment caused increased ACE2 activity and MasR levels but decreased AT₁R levels and renin activity. Thus, long-term AT2R activation shifts the opposing arms of renin angiotensin system and contributes to natriuresis and blood pressure reduction in obese animals. Our study highlights the importance of AT2R as a target for treating obesity-related hypertension.


Figures

Fig. 1
Fig. 1
Schematic representation of the protocol used in the renal function study.
Fig.2
Fig.2
(A) Food (B) water intake (C) urinary volume (D) urinary sodium excretion (UNaV) and (E) glomerular filtration rate (GFR) measured using FITC-inulin clearance method in conscious control and CGP-treated lean and obese Zucker rats. *significantly different compared with lean control rats, #significantly different compared with obese control rats. Values are represented as mean±SEM; One way ANOVA followed by Neuman-Keuls test, p<0.05; N=5-7 in each group). (LCT- lean control, LCGP-lean treated with CGP42112A, OCT-obese control, OCGP-obese treated with CGP42112A).
Fig.2
Fig.2
(A) Food (B) water intake (C) urinary volume (D) urinary sodium excretion (UNaV) and (E) glomerular filtration rate (GFR) measured using FITC-inulin clearance method in conscious control and CGP-treated lean and obese Zucker rats. *significantly different compared with lean control rats, #significantly different compared with obese control rats. Values are represented as mean±SEM; One way ANOVA followed by Neuman-Keuls test, p<0.05; N=5-7 in each group). (LCT- lean control, LCGP-lean treated with CGP42112A, OCT-obese control, OCGP-obese treated with CGP42112A).
Fig. 3
Fig. 3
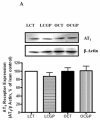
Expression of (A) AT1R and (B) AT2R in the kidney cortex of control and CGP-treated lean and obese Zucker rats. Upper panels: Representative Western blots for respective proteins with loading control β-actin. Bar graphs: represent the ratios of densities of the respective protein bands and β-Actin i.e. AT1/β-Actin, AT2/β-Actin *significantly different compared with lean control rats. Values are represented as mean±SEM; One-way ANOVA followed by Neuman-Keuls test, p<0.05; N=5-7 in each group). (LCT- lean control, LCGP-lean treated with CGP42112A, OCT-obese control, OCGP-obese treated with CGP42112A).
Fig. 3
Fig. 3
Expression of (A) AT1R and (B) AT2R in the kidney cortex of control and CGP-treated lean and obese Zucker rats. Upper panels: Representative Western blots for respective proteins with loading control β-actin. Bar graphs: represent the ratios of densities of the respective protein bands and β-Actin i.e. AT1/β-Actin, AT2/β-Actin *significantly different compared with lean control rats. Values are represented as mean±SEM; One-way ANOVA followed by Neuman-Keuls test, p<0.05; N=5-7 in each group). (LCT- lean control, LCGP-lean treated with CGP42112A, OCT-obese control, OCGP-obese treated with CGP42112A).
Fig. 4
Fig. 4
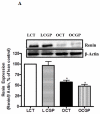
Expression of (A) renin and (B) ACE in the kidney cortex of control and CGP-treated lean and obese Zucker rats. Upper panels: Representative Western blots for respective proteins with loading control β-actin. Bar graphs: represent the ratios of densities of respective protein bands and β-Actin i.e. renin/β-Actin, ACE/β-Actin *significantly different compared with lean control rats. Values are represented as mean±SEM; One-way ANOVA followed by Neuman-Keuls test, p<0.05; N=5-7 in each group). (LCT- lean control, LCGP-lean treated with CGP42112A, OCT-obese control, OCGP-obese treated with CGP42112A).
Fig. 4
Fig. 4
Expression of (A) renin and (B) ACE in the kidney cortex of control and CGP-treated lean and obese Zucker rats. Upper panels: Representative Western blots for respective proteins with loading control β-actin. Bar graphs: represent the ratios of densities of respective protein bands and β-Actin i.e. renin/β-Actin, ACE/β-Actin *significantly different compared with lean control rats. Values are represented as mean±SEM; One-way ANOVA followed by Neuman-Keuls test, p<0.05; N=5-7 in each group). (LCT- lean control, LCGP-lean treated with CGP42112A, OCT-obese control, OCGP-obese treated with CGP42112A).
Fig. 5
Fig. 5
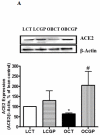
(A) ACE2 expression (B) ACE2 activity and (C) Mas receptor expression in the kidney cortex of control and CGP-treated lean and obese Zucker rats. Upper panels: Representative Western blots for respective proteins with loading control β-actin. For Western blot only, bar graphs represent the ratios of densities of respective protein bands and β-Actin i.e. ACE2/β-Actin, MasR/β-Actin $significantly different compared with lean control rats, #significantly different compared with obese control rats. Values are represented as mean±SEM; One-way ANOVA followed by Neuman-Keuls test, p<0.05; N=5-7 in each group). (LCT- lean control, LCGP-lean treated with CGP42112A, OCT-obese control, OCGP-obese treated with CGP42112A).
Fig. 5
Fig. 5
(A) ACE2 expression (B) ACE2 activity and (C) Mas receptor expression in the kidney cortex of control and CGP-treated lean and obese Zucker rats. Upper panels: Representative Western blots for respective proteins with loading control β-actin. For Western blot only, bar graphs represent the ratios of densities of respective protein bands and β-Actin i.e. ACE2/β-Actin, MasR/β-Actin $significantly different compared with lean control rats, #significantly different compared with obese control rats. Values are represented as mean±SEM; One-way ANOVA followed by Neuman-Keuls test, p<0.05; N=5-7 in each group). (LCT- lean control, LCGP-lean treated with CGP42112A, OCT-obese control, OCGP-obese treated with CGP42112A).
Fig 6
Fig 6
LC/MS quantification of (A) Angiotensin II and (B) Angiotensin-(1-7) in the kidney cortex of control and CGP-treated lean and obese rats. #significantly different compared with obese control rats, Values are represented as mean±SEM; One-way ANOVA with Newman-Keuls test, p<0.05; N =5-7 in each group. (LCT- lean control, LCGP-lean treated with CGP42112A, OCT-obese control, OCGP-obese treated with CGP42112A).
Fig 6
Fig 6
LC/MS quantification of (A) Angiotensin II and (B) Angiotensin-(1-7) in the kidney cortex of control and CGP-treated lean and obese rats. #significantly different compared with obese control rats, Values are represented as mean±SEM; One-way ANOVA with Newman-Keuls test, p<0.05; N =5-7 in each group. (LCT- lean control, LCGP-lean treated with CGP42112A, OCT-obese control, OCGP-obese treated with CGP42112A).
Fig 7
Fig 7
Effect of candesartan (100 μg/kg bolus) on (A) diuresis (B) natriuresis (C) mean arterial pressure and (D) heart rate in control and CGP-treated obese Zucker rats. *significantly different compared with control basal, #significantly different compared with control candesartan. Values are represented as mean ± SEM; One-way ANOVA followed by Neuman-Keuls test, p<0.05, N=5 rats in each group). (OBCT-obese control, OCGP-obese treated with CGP42112A).
Fig 7
Fig 7
Effect of candesartan (100 μg/kg bolus) on (A) diuresis (B) natriuresis (C) mean arterial pressure and (D) heart rate in control and CGP-treated obese Zucker rats. *significantly different compared with control basal, #significantly different compared with control candesartan. Values are represented as mean ± SEM; One-way ANOVA followed by Neuman-Keuls test, p<0.05, N=5 rats in each group). (OBCT-obese control, OCGP-obese treated with CGP42112A).
Fig 8
Fig 8
Effect of AT2R agonist and antagonist on (A) ACE2 activity (B) MasR expression (C) Renin activity and (D) AT1R expression. Upper panels: Representative Western blots for respective proteins with loading control β-actin. Bar graphs: represent the ratios of densities of respective protein bands and β-Actin i.e AT1/β-Actin, Mas/β-Actin. *significantly different compared with control. Values are represented as mean ± SEM; One-way ANOVA followed by Neuman-Keuls test, p<0.05, N=6-7 in each group). (CT-control, CGP-CGP42112A, PD-PD123319).
Fig 8
Fig 8
Effect of AT2R agonist and antagonist on (A) ACE2 activity (B) MasR expression (C) Renin activity and (D) AT1R expression. Upper panels: Representative Western blots for respective proteins with loading control β-actin. Bar graphs: represent the ratios of densities of respective protein bands and β-Actin i.e AT1/β-Actin, Mas/β-Actin. *significantly different compared with control. Values are represented as mean ± SEM; One-way ANOVA followed by Neuman-Keuls test, p<0.05, N=6-7 in each group). (CT-control, CGP-CGP42112A, PD-PD123319).

References

    1. Vickers C, Hales P, Kaushik V, et al. Hydrolysis of biological peptides by human angiotensin-converting enzyme-related carboxypeptidase. J Biol Chem. 2002;277:14838–14843. - PubMed
    1. Rice GI, Thomas DA, Grant PJ, et al. Evaluation of angiotensin-converting enzyme (ACE), its homologue ACE2 and neprilysin in angiotensin peptide metabolism. Biochem J. 2004;383:45–51. - PMC - PubMed
    1. de Gasparo M, Catt KJ, Inagami T, et al. International union of pharmacology. XXIII. The angiotensin II receptors. Pharmacol Rev. 2000;52:415–472. - PubMed
    1. Akishita M, Ito M, Lehtonen JY, et al. Expression of the AT2 receptor developmentally programs extracellular signal-regulated kinase activity and influences fetal vascular growth. J Clin Invest. 1999;103:63–71. - PMC - PubMed
    1. Masaki H, Kurihara T, Yamaki A, et al. Cardiac-specific overexpression of angiotensin II AT2 receptor causes attenuated response to AT1 receptor-mediated pressor and chronotropic effects. J Clin Invest. 1998;101:527–535. - PMC - PubMed

Publication types

MeSH terms