. 2013 Jul 25;499(7459):471-5.
doi: 10.1038/nature12228. Epub 2013 Jul 3.

Great ape genetic diversity and population history

Affiliations

Great ape genetic diversity and population history

Javier Prado-Martinez et al. Nature. .

Abstract

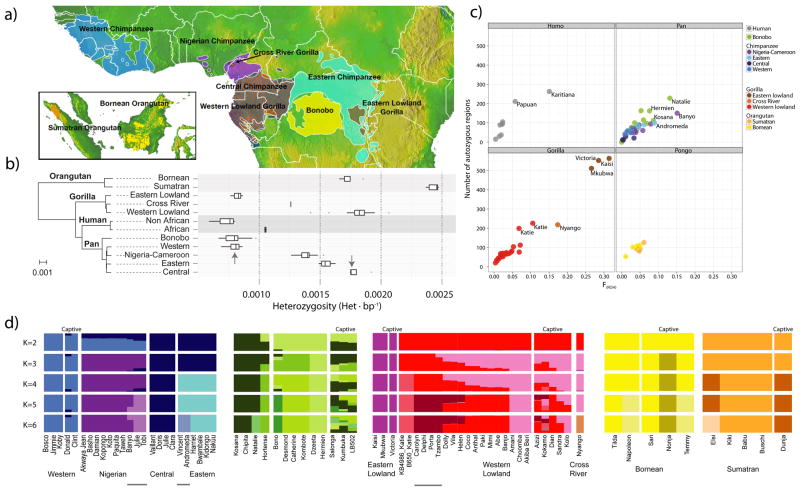
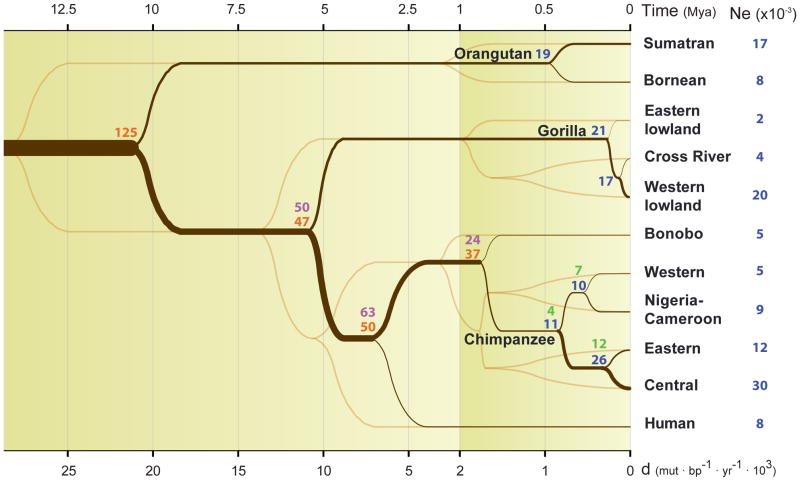
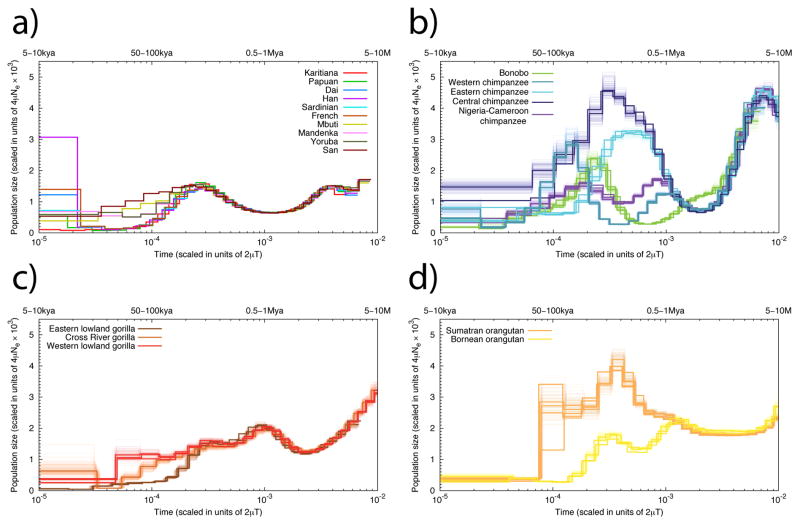
Most great ape genetic variation remains uncharacterized; however, its study is critical for understanding population history, recombination, selection and susceptibility to disease. Here we sequence to high coverage a total of 79 wild- and captive-born individuals representing all six great ape species and seven subspecies and report 88.8 million single nucleotide polymorphisms. Our analysis provides support for genetically distinct populations within each species, signals of gene flow, and the split of common chimpanzees into two distinct groups: Nigeria-Cameroon/western and central/eastern populations. We find extensive inbreeding in almost all wild populations, with eastern gorillas being the most extreme. Inferred effective population sizes have varied radically over time in different lineages and this appears to have a profound effect on the genetic diversity at, or close to, genes in almost all species. We discover and assign 1,982 loss-of-function variants throughout the human and great ape lineages, determining that the rate of gene loss has not been different in the human branch compared to other internal branches in the great ape phylogeny. This comprehensive catalogue of great ape genome diversity provides a framework for understanding evolution and a resource for more effective management of wild and captive great ape populations.


Conflict of interest statement

The authors declare no competing financial interests.

Figures

Figure 1
Figure 1. Samples, heterozygosity and genetic diversity
a. Geographical distribution of great ape populations across Indonesia and Africa sequenced in this study. The formation of the islands of Borneo and Sumatra resulted in the speciation of the two corresponding orangutan populations. The Sanaga River forms a natural boundary between Nigeria-Cameroon and Central chimpanzee populations while the Congo River separates the bonobo population from the Central and Eastern chimpanzees. Eastern lowland and Western lowland gorillas are both separated by a large geographical distance. b. Heterozygosity estimates of each of the individual species and subspecies are superimposed onto a neighbor-joining tree from genome-wide genetic distance estimates. Arrows indicate heterozygosities previously reported for Western and Central chimpanzee populations c. Runs of homozygosity among great apes. The relationship between the coefficient of inbreeding (FROH) and the number of autozygous >1 Mbp segments is shown. Bonobos and Eastern lowland gorillas show an excess of inbreeding compared to the other great apes, suggesting small population sizes or a fragmented population. d. Genetic structure based on clustering of great apes. All individuals (columns) are grouped into different clusters (K=2 to K=6, rows) colored by species and according to their common genetic structure. Most captive individuals, labeled on top, show a complex admixture from different wild populations. A signature of admixture, for example, is clearly observed in the known hybrid Donald, a second-generation captive where we predict 15% admixture of Central chimpanzee on a Western background consistent with its pedigree. A gray line at the bottom denotes new groups at K=6 in agreement with the location of origin or ancestral admixture.
Figure 2
Figure 2. Inferred population history
Population splits and effective population sizes (Ne) during great ape evolution. Split times (dark brown) and divergence times (light brown) are plotted as a function of divergence (d) on the bottom and time on top. Time is estimated using a single mutation rate (μ) of 1·10−9 mut/(bp·year). The ancestral and current effective population sizes are also estimated using this mutation rate. The results from several methods used to estimate Ne, (COALHMM, ILS COALHMM, PSMC and ABC are colored in orange, purple, blue and green respectively). The chimpanzee split times are estimated using the ABC method. The x-axis is rescaled for divergences larger than 2·10−3 to provide more resolution in recent splits. All the values used in this figure can be found in Table S5.
Figure 3
Figure 3. PSMC analysis
Inferred historical population sizes by PSMC. The lower x-axis gives time measured by pairwise sequence divergence and the y-axis gives the effective population size measured by the scaled mutation rate. The upper x-axis indicates scaling in years, assuming a mutation rate ranging from 10−9 to 5·10−10 per site per year. The top left panel shows the inference for modern human populations. In the rest of the three panels, thin light lines of the same color correspond to PSMC inferences on 100 rounds of bootstrapped sequences.

References

    1. Gonder MK, et al. A new west African chimpanzee subspecies? Nature. 1997;388:337. - PubMed
    1. Gonder MK, et al. Evidence from Cameroon reveals differences in the genetic structure and histories of chimpanzee populations. PNAS. 2011;108:4766–4771. - PMC - PubMed
    1. Hobolth A, Christensen OF, Mailund T, Schierup MH. Genomic Relationships and Speciation Times of Human, Chimpanzee, and Gorilla Inferred from a Coalescent Hidden Markov Model. PLoS Genetics. 2007;3:11. - PMC - PubMed
    1. Hey J. The divergence of chimpanzee species and subspecies as revealed in multipopulation isolation-with-migration analyses. Molecular biology and evolution. 2010;27:921–33. - PMC - PubMed
    1. Becquet C, Przeworski M. A new approach to estimate parameters of speciation models with application to apes. 2007:1505–1519. doi: 10.1101/gr.6409707. - DOI - PMC - PubMed

Publication types

MeSH terms