. 2013 Oct;56(10):2266-74.
doi: 10.1007/s00125-013-2981-2. Epub 2013 Jul 4.

Prediction of non-alcoholic fatty-liver disease and liver fat content by serum molecular lipids

Affiliations

Prediction of non-alcoholic fatty-liver disease and liver fat content by serum molecular lipids

Matej Orešič et al. Diabetologia. 2013 Oct.

Abstract

Aims/hypothesis: We examined whether analysis of lipids by ultra-performance liquid chromatography (UPLC) coupled to MS allows the development of a laboratory test for non-alcoholic fatty-liver disease (NAFLD), and how a lipid-profile biomarker compares with the prediction of NAFLD and liver-fat content based on routinely available clinical and laboratory data.

Methods: We analysed the concentrations of molecular lipids by UPLC-MS in blood samples of 679 well-characterised individuals in whom liver-fat content was measured using proton magnetic resonance spectroscopy ((1)H-MRS) or liver biopsy. The participants were divided into biomarker-discovery (n = 287) and validation (n = 392) groups to build and validate the diagnostic models, respectively.

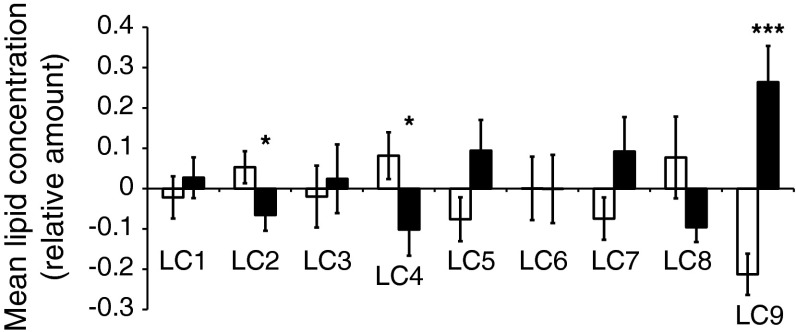
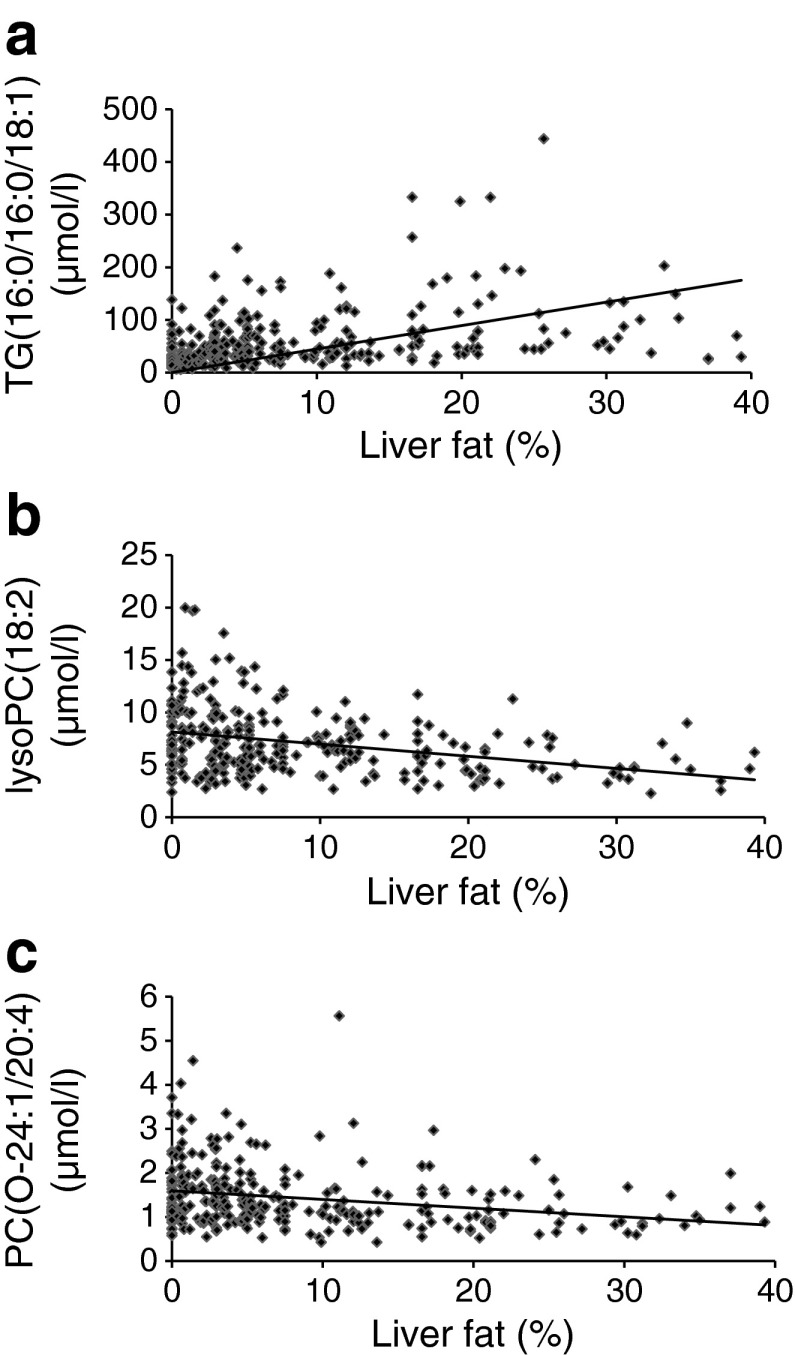
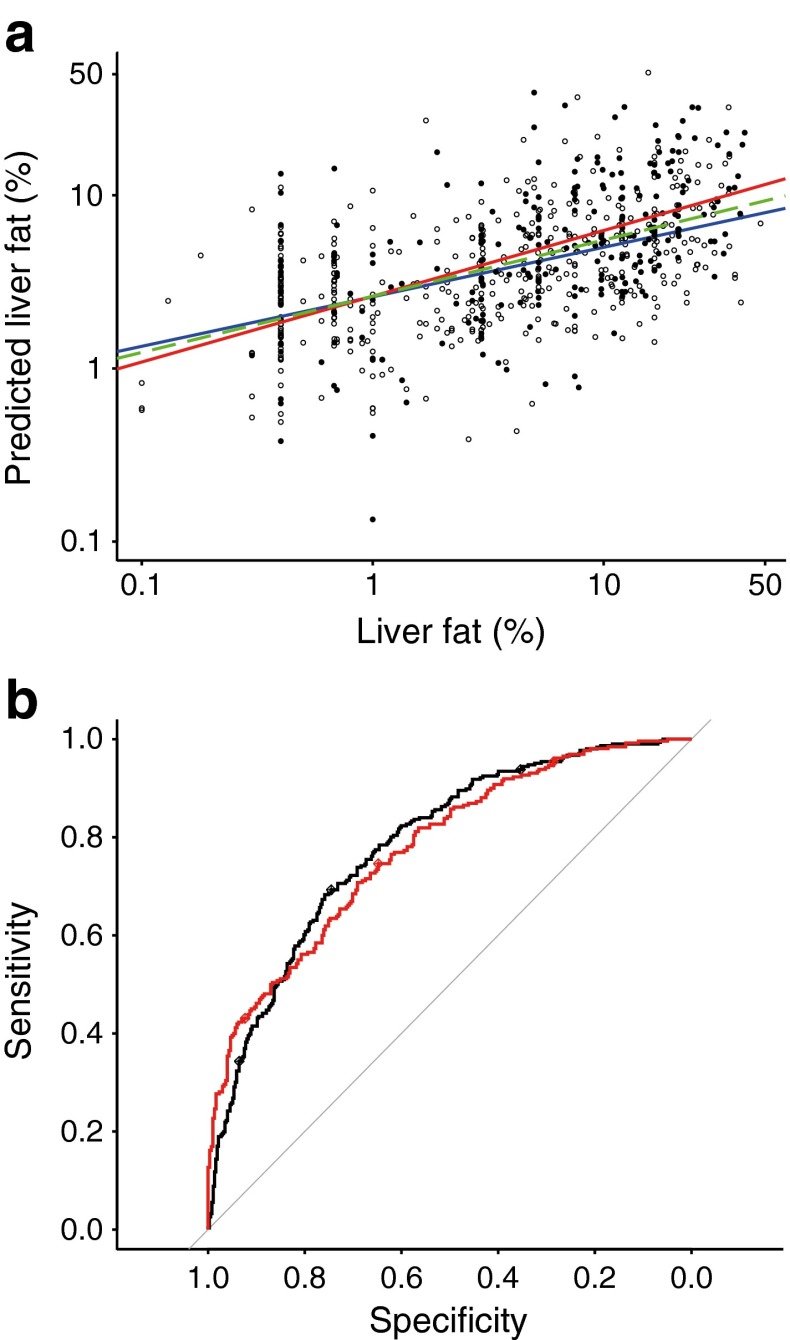
Results: Individuals with NAFLD had increased triacylglycerols with low carbon number and double-bond content while lysophosphatidylcholines and ether phospholipids were diminished in those with NAFLD. A serum-lipid signature comprising three molecular lipids ('lipid triplet') was developed to estimate the percentage of liver fat. It had a sensitivity of 69.1% and specificity of 73.8% when applied for diagnosis of NAFLD in the validation series. The usefulness of the lipid triplet was demonstrated in a weight-loss intervention study.

Conclusions/interpretation: The liver-fat-biomarker signature based on molecular lipids may provide a non-invasive tool to diagnose NAFLD, in addition to highlighting lipid molecular pathways involved in the disease.


Figures

Fig. 1
Fig. 1
Mean lipid levels within each cluster, shown separately for patients with NAFLD (NAFLD+, black bars) and without NAFLD (NAFLD−, white bars) in the biomarker-discovery cohort. The data for each lipid are scaled to zero mean and unit variance. Statistical comparison was performed using the two-sided t test. The cluster summaries are shown in Table 2. Error marks show standard error of the mean. *p < 0.05 vs NAFLD−; ***p < 0.001 vs NAFLD−. For LC7 the two groups are different at the marginal significance level (p = 0.097)
Fig. 2
Fig. 2
The relationship between liver-fat content and the selected representative lipids from the clusters that are significantly altered in NAFLD: (a) TG(16:0/16:0/18:1) from cluster LC9 (Spearman rank correlation r, 0.45, p < 0.001); (b) lysoPC from LC2 (r, −0.32, p < 0.001); and (c) PC(O-24:1/20:4) from LC4 (r −0.31, p < 0.001). The regression lines are drawn as guides
Fig. 3
Fig. 3
Prediction of liver-fat content from the model including three lipids, TG(48:0), PC(O-24:1/20:4) and PC(18:1/22:6). (a) The relationship between measured and predicted liver fat (log10 scale on both axes). Pearson correlation coefficient r 0.54 (p < 0.001). Black circles, men; white circles, women. (b) ROC curve for NAFLD diagnosis (biomarker-discovery and validation series combined), based on predicted liver fat, and the ROC curves of the reference model [10]. Test lipid combination AUC 0.79 (95% CI 0.75, 0.82), reference AUC 0.78 (95% CI 0.74, 0.82). Optimal cut-off point corresponding to the maximum sum of sensitivity and specificity: test lipid combination 0.648 (95% CI 0.745, 0.693); reference 0.409 (95% CI 0.648, 0.746). Cut-off point for 95% sensitivity: test lipid combination 0.353 (95% CI 0.354, 0.938); reference 0.241 (95% CI 0.286, 0.954). Cut-off point for 95% specificity: test lipid combination 0.918 (95% CI 0.936, 0.343); reference 0.723 (95% CI 0.924, 0.431). Black curve, biomarker-discovery and validation series combined; red curve, reference
Fig. 4
Fig. 4
Comparison of measured and estimated liver fat using the serum molecular signature in participants before and after intervention with rimonabant or placebo (log10 scale on both axes). Pearson correlation coefficient r, 0.53 (p < 0.001). White circles, placebo at baseline; white squares, rimonabant at baseline; black circles, placebo at 48 weeks; black squares, rimonabant at 48 weeks

References

    1. Angulo P. Nonalcoholic fatty liver disease. N Engl J Med. 2002;346:1221–1231. doi: 10.1056/NEJMra011775. - DOI - PubMed
    1. Targher G. Non-alcoholic fatty liver disease as a determinant of cardiovascular disease. Atherosclerosis. 2007;190:18–19. doi: 10.1016/j.atherosclerosis.2006.06.004. - DOI - PubMed
    1. Adams LA, Waters OR, Knuiman MW, Elliott RR, Olynyk JK. NAFLD as a risk factor for the development of diabetes and the metabolic syndrome: an eleven-year follow-up study. Am J Gastroenterol. 2009;104:861–867. doi: 10.1038/ajg.2009.67. - DOI - PubMed
    1. Kotronen A, Yki-Jarvinen H. Fatty liver: a novel component of the metabolic syndrome. Arterioscler Thromb Vasc Biol. 2008;28:27–38. doi: 10.1161/ATVBAHA.107.147538. - DOI - PubMed
    1. Van Gaal LF, Mertens IL, de Block CE. Mechanisms linking obesity with cardiovascular disease. Nature. 2006;444:875–880. doi: 10.1038/nature05487. - DOI - PubMed

Publication types