. 2013 Jul 15;27(14):1581-95.
doi: 10.1101/gad.211037.112. Epub 2013 Jul 3.

USP49 deubiquitinates histone H2B and regulates cotranscriptional pre-mRNA splicing

Affiliations

USP49 deubiquitinates histone H2B and regulates cotranscriptional pre-mRNA splicing

Zhuo Zhang et al. Genes Dev. .

Abstract

Post-translational histone modifications play important roles in regulating chromatin structure and function. Histone H2B ubiquitination and deubiquitination have been implicated in transcriptional regulation, but the function of H2B deubiquitination is not well defined, particularly in higher eukaryotes. Here we report the purification of ubiquitin-specific peptidase 49 (USP49) as a histone H2B-specific deubiquitinase and demonstrate that H2B deubiquitination by USP49 is required for efficient cotranscriptional splicing of a large set of exons. USP49 forms a complex with RuvB-like1 (RVB1) and SUG1 and specifically deubiquitinates histone H2B in vitro and in vivo. USP49 knockdown results in small changes in gene expression but affects the abundance of >9000 isoforms. Exons down-regulated in USP49 knockdown cells show both elevated levels of alternative splicing and a general decrease in splicing efficiency. Importantly, USP49 is relatively enriched at this set of exons. USP49 knockdown increased H2B ubiquitination (uH2B) levels at these exons as well as upstream 3' and downstream 5' intronic splicing elements. Change in H2B ubiquitination level, as modulated by USP49, regulates U1A and U2B association with chromatin and binding to nascent pre-mRNA. Although H3 levels are relatively stable after USP49 depletion, H2B levels at these exons are dramatically increased, suggesting that uH2B may enhance nucleosome stability. Therefore, this study identifies USP49 as a histone H2B-specific deubiquitinase and uncovers a critical role for H2B deubiquitination in cotranscriptional pre-mRNA processing events.

Keywords: H2B deubiquitination; USP49; pre-mRNA splicing; transcription.


Figures
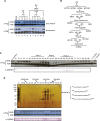
Figure 1.
Figure 1.
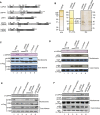
Purification of USP49 as a putative histone H2B deubiquitinase. (A) H2B deubiquitination assay with HeLa cell nuclear proteins fractionated on DE52 and P11 columns. Numbers indicate the salt concentration (molar) for step elution. The top and bottom panels use core histone and nucleosome as substrates, respectively. (B) Schematic representation of the steps used to purify the histone H2B deubiquitinase. Numbers represent the salt concentrations (millimolar) at which the H2B deubiquitinase activity elutes from the columns. (C) H2B deubiquitination assay (top panel) and Western blot analysis (bottom panel) of the fractions derived from the DEAE5PW column. Antibodies are indicated at the left side of the panel. NE 0.5 M was used as positive control. BC50 was used as negative control. (D) Silver staining of a polyacrylamide–SDS gel (top panel), H2B deubiquitination activity assay (second panel), and Western blot analysis (bottom panel) of the fractions derived from the Superose 6 column. Candidate bands are labeled with red asterisks. USP49 is also indicated by an arrow, and identified peptides are labeled on the right side of the top panel. The elution profile of the protein markers is indicated at the top of the panel.
Figure 2.
Figure 2.
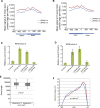
USP49 interacts with RVB1 and SUG1 and specifically deubiquitinates uH2B in vitro. (A) Schematic representation of USP49, USP44, USP3, USP16 (Ubp-M), and USP22 (Ubp-8). Positions of ZnF-UBP and UCH domains are shown. The cysteine residues corresponding to the catalytic triad are also shown. Numbers represent the amino acid position. (B) Silver staining of a SDS-PAGE containing USP49 purified from sf9 cells (left), the USP49 complex from the HeLa S3 stable cell line (middle), and the reconstituted wild-type USP49 and C262A mutant USP49 complexes (right). The identities of each polypeptide are labeled. Peptides identified by mass spectrometry analysis are included in Supplemental Figure S1. (C) H2B deubiquitination assay of USP49 and the USP49 complex. The top panel shows the amount of USP49 used in the assay. Note: USP49 purified from sf9 cells migrated slower than USP49 purified from HeLa stable cell lines on SDS-PAGE because two Myc tags were added to the USP49 C terminus. The middle panel shows assays with nucleosomes as substrates, and the bottom panel shows assays with core histone as substrates. The NE 0.5 M fraction was used as a positive control for nucleosomes, and the NE 0.3 M fraction was used as a positive control for core histone. BC50 was used as a negative control. (D) H2A deubiquitination assay of USP49 and the USP49 complex. The top panel shows the amount of USP49 used in the assay. The second and third panels show assays with nucleosomes as substrates, and the bottom two panels show assays with core histone as substrates. The NE 0.5 M fraction was used as a positive control. BC50 was used as a negative control. (E) H2B deubiquitination assay of reconstituted wild-type and mutant USP49 complex and the USP49 complex purified from HeLa cells. The top panel shows the amount of USP49 used in the assay. The middle panel shows assays with nucleosomes as substrates, and the bottom panel shows assays with core histone as substrates. The NE 0.5 M fraction was used as a positive control for nucleosomes, and the NE 0.3 M fraction was used as a positive control for core histone. BC50 was used as a negative control. (F) H2A deubiquitination assay of reconstituted wild-type and mutant USP49 complex and the USP49 complex purified from HeLa cells. The top panel shows the amount of USP49 used in the assay. The second and third panels show assays with nucleosomes as substrates, and the bottom two panels show assays with core histone as substrates. The NE 0.5 M fraction was used as a positive control. BC50 was used as a negative control.
Figure 3.
Figure 3.
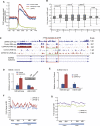
USP49 deubiquitinates uH2B in vivo. (A) Overexpression of wild-type but not C262A mutant USP49 reduces the levels of uH2B in 293T cells. Western blot assay of cells transfected with expression vectors as indicated at the top of the panels. Antibodies used are indicated at the left side of the panels. (B) Knockdown of USP49 results in an increase of the levels of uH2B in 293T cells. Cells were transfected with siRNA as indicated at the top of the panels and were subjected to Western blot assay. Antibodies used are indicated at the left side of the panels. (C) Expression of wild-type but not C262A mutant USP49 restores histone uH2B levels induced by USP49 knockdown. USP49-inducible knockdown cells were transfected with wild-type and C262A mutant USP49 and subjected to Western blot assay. USP49 is marked with an arrow, and nonspecific bands are marked with asterisks. Antibodies used are indicated at the left side of the panels.
Figure 4.
Figure 4.
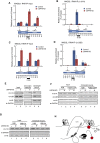
USP49 depletion affects pre-mRNA splicing. (A) A box and whisker plot of fold change (log2) in differentially expressed genes and transcripts (cutoff value, P = 0.05) in control and USP49 knockdown cells as determined by RNA-seq analysis. The lower end of the box represents the 25th percentile, the upper end of the box represents the 75th percentile, the bar represents the median, and the upper and lower whiskers represent the 99th and first percentiles, respectively. (B) The mean (columns) and variance (bars) of change in exon inclusion levels for exons up-regulated or down-regulated in USP49 knockdown cells. Statistical significance was calculated using a Student's t-test. (C) A representative image of the SLMO2 transcript, showing a relative increase in intron-aligning tags in USP49 knockdown cells. The control RNA-seq is shown in blue, and the USP49 knockdown are in red. The exons (thick blue boxes) and introns (thin blue lines) are shown at the bottom of the panels. The region showing decreased splicing efficiency is indicated by the red box. (D) A box and whisker plot, as described in Figure 3A, showing the fold change in unspliced transcripts for exons up-regulated or down-regulated in USP49 knockdown cells. Statistical significance was calculated using a Student's t-test. (E) Real-time RT–PCR analysis of intron 4 of RPS3 (left) and RPS6 (right) genes in control and USP49 knockdown cells. USP49 knockdown is associated with an increase in intron levels. (F,G) Real-time quantitative PCR (qPCR) analysis of intron 4 of RPS3 (F) and RPS6 (G) in chromatin-bound and nucleoplasmic RNA fractions. Blue bars indicate intron levels in controls. Red bars represent intron levels in USP49 knockdown cells.
Figure 5.
Figure 5.
USP49 is enriched at a subset of down-regulated exons and regulates exon splicing. (A,B) A metaexon analysis of USP49 ChIP-seq signal at the 5′ intron–exon boundary (A) or 3′ exon–intron boundary (B) from exons up-regulated (blue; n = 4038) or down-regulated (red; n = 2995) in USP49 knockdown cells. Coordinates are numbered relative to the 5′ intron–exon or 3′ exon–intron boundaries. The average number of tags that were found at each position is shown on the Y-axis normalized according to tags per million total unique tags. (C,D) Real-time qPCR of RPS4 (C) and RPS6 (D) intron 4 in control or USP49 knockdown cells transfected with wild-type or C262A mutant USP49. The defects in intron splicing of RPS3 and RPS6 transcripts can be rescued by expression of wild-type but not C262A mutant USP49. (E) A box and whisker plot showing the median length of genes containing exons up-regulated or down-regulated in USP49 knockdown cells. Statistical significance was calculated using a Student's t-test. (F) A diagram depicting the percent of exons up-regulated (blue) or down-regulated (red) at different relative positions along the gene body. Down-regulated exons are preferentially located toward the 3′ end of the gene. Statistical significance was calculated using a Student's t-test. (TSS) Transcription start site; (pA) cleavage/polyadenylation site.
Figure 6.
Figure 6.
USP49 knockdown results in an increase of uH2B level. (A) Average USP49 (green) and uH2B (control [blue]; USP49 knockdown [red]) occupancy profiles across transcribed regions of expressed genes plus 10 kb upstream of and downstream from the transcriptional start and transcriptional termination sites. (TSS) Transcription start site; (pA) cleavage/polyadenylation site. (B) Fold change (log2) in uH2B levels of exons up-regulated or down-regulated in USP49 knockdown cells. Log2 fold change is significantly greater at down-regulated exons and their 3′ and 5′ splice sites. Statistical significance was calculated using a Student's t-test. (C) A representative image of SLMO2 with aligned tags from the USP49 ChIP-seq, RNA-seq, and uH2B ChIP-seq in control and USP49 knockdown cells. Control samples are shown in blue, and USP49 knockdown samples are shown in red. The red box indicates the region with lower SC in USP49 knockdown cells. (D,E) Real-time RT–PCR analysis of MAD2L1 intron 2 (D) and SLMO2 intron 2 (E) in control and USP49 knockdown cells transfected with wild-type H2B and the H2B K120R mutant. Transfection of wild-type H2B does not interfere with USP49 knockdown-induced splicing defects, but transfection of H2B K120R abolishes USP49 knockdown-induced splicing defects. A Western blot assay of the expression level of wild-type and K120R mutant H2B is inset in D. (F,G) A metaexon analysis of fold change in uH2B (F) and H2B (G) ChIP-seq signal at the 5′ intron–exon boundary from exons up-regulated (blue; n = 4038) or down-regulated (red; n = 2995) in USP49 knockdown cells. Coordinates are numbered relative to the 5′ intron–exon boundary.
Figure 7.
Figure 7.
USP49 and H2B deubiquitination regulates U1A and U2B association with chromatin and mRNA. (A,B) RT-qPCR analysis of input (A) and U1A RNA immunoprecipitates (B) on MAD2L1 transcript. Regions for real-time PCR amplification, corresponding to exon–intron junctions, are shown at the bottom. (C,D) RT-qPCR analysis of input (C) and U2B RNA immunoprecipitates (D) on MAD2L1 transcript. Regions for real-time PCR amplification, corresponding to exon–intron junctions, are shown at the bottom. (E) Western blot assay of U1A and U2B binding to chromatin in control and USP49 knockdown cells. Antibodies used are labeled at the left side of the panels. (F) Western blot assay of U1A and U2B binding to chromatin in USP49 control and USP49 knockdown cells transfected with wild-type H2B and the H2B K120R mutant. Transfection of wild-type H2B has no effect on USP49 knockdown-induced decrease of U1A or U2B binding to chromatin, but transfection of H2B K120R abolishes the USP49 knockdown-induced decrease of U1A and U2B binding to chromatin. (G) H2B-ubiquitin fusion protein reduces the association of U1A with chromatin. Western blot assay of U1A tethering to chromatin in control and USP49 knockdown cells transfected with H2B and H2B-ubiquitin fusion constructs. (H) A proposed model of USP49-regulated cotranscriptional splicing. USP49 regulates uH2B levels at specific exons and 3′ and 5′ splice regions. In USP49 knockdown cells, uH2B levels are increased at these regions. uH2B enhances nucleosome stability, altering RNAP II elongation. The RNAP II elongation rate has been shown to regulate cotranscriptional splicing efficiency and splicing factor recruitment and favor alternative splicing.

References

    1. Allo M, Buggiano V, Fededa JP, Petrillo E, Schor I, de la Mata M, Agirre E, Plass M, Eyras E, Elela SA, et al. 2009. Control of alternative splicing through siRNA-mediated transcriptional gene silencing. Nat Struct Mol Biol 16: 717–724 - PubMed
    1. Ameur A, Zaghlool A, Halvardson J, Wetterbom A, Gyllensten U, Cavelier L, Feuk L 2011. Total RNA sequencing reveals nascent transcription and widespread co-transcriptional splicing in the human brain. Nat Struct Mol Biol 18: 1435–1440 - PubMed
    1. Andersson R, Enroth S, Rada-Iglesias A, Wadelius C, Komorowski J 2009. Nucleosomes are well positioned in exons and carry characteristic histone modifications. Genome Res 19: 1732–1741 - PMC - PubMed
    1. Batta K, Zhang Z, Yen K, Goffman DB, Pugh BF 2011. Genome-wide function of H2B ubiquitylation in promoter and genic regions. Genes Dev 25: 2254–2265 - PMC - PubMed
    1. Buszczak M, Paterno S, Spradling AC 2009. Drosophila stem cells share a common requirement for the histone H2B ubiquitin protease Scrawny. Science 323: 248–251 - PMC - PubMed

Publication types

MeSH terms