. 2013 Aug 1;191(3):1260-75.
doi: 10.4049/jimmunol.1300770. Epub 2013 Jul 3.

Common tolerance mechanisms, but distinct cross-reactivities associated with gp41 and lipids, limit production of HIV-1 broad neutralizing antibodies 2F5 and 4E10

Affiliations

Common tolerance mechanisms, but distinct cross-reactivities associated with gp41 and lipids, limit production of HIV-1 broad neutralizing antibodies 2F5 and 4E10

Yao Chen et al. J Immunol. .

Abstract

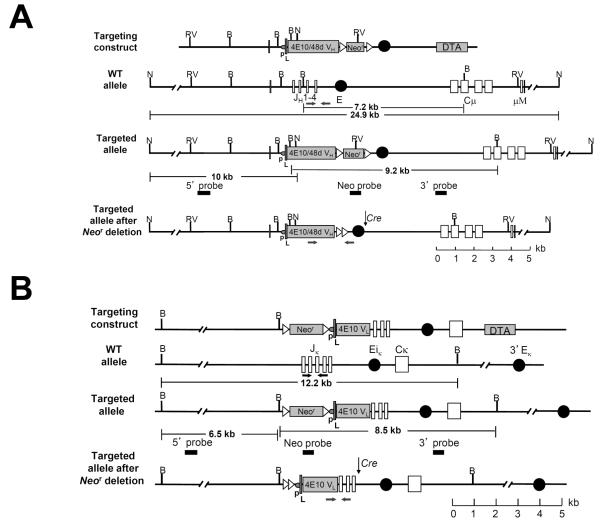
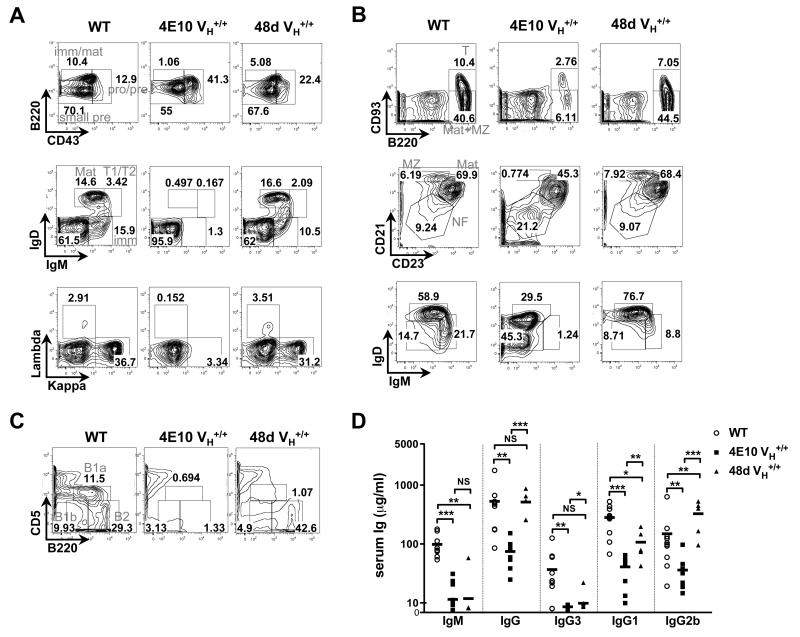
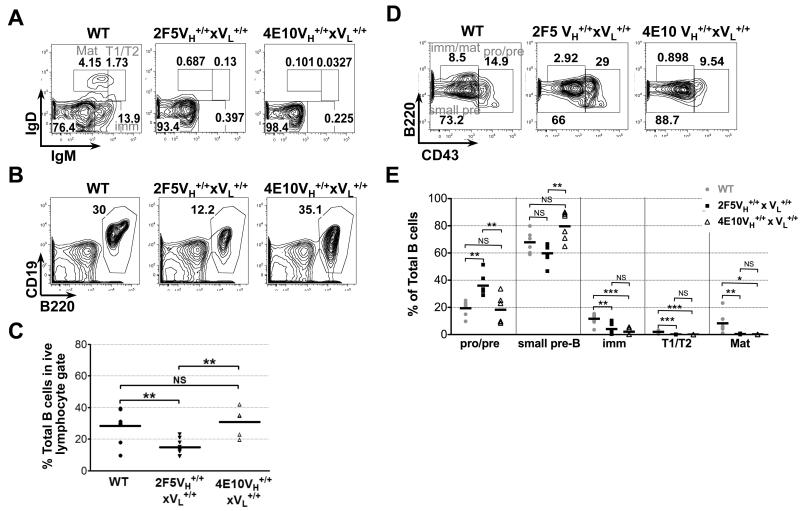
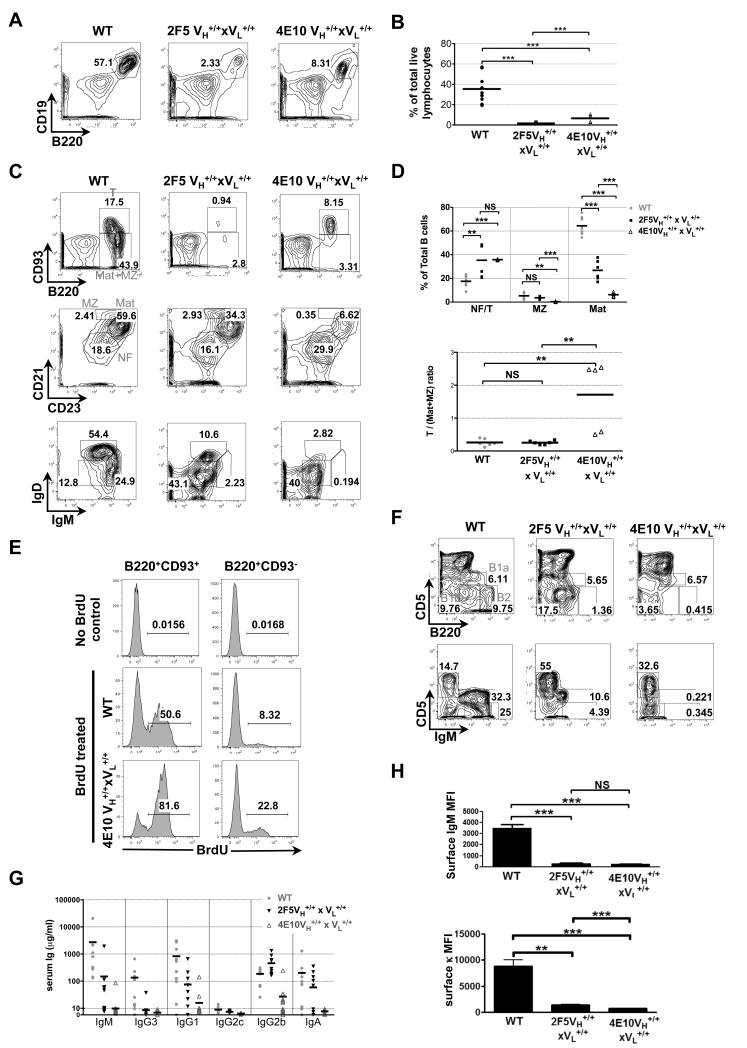
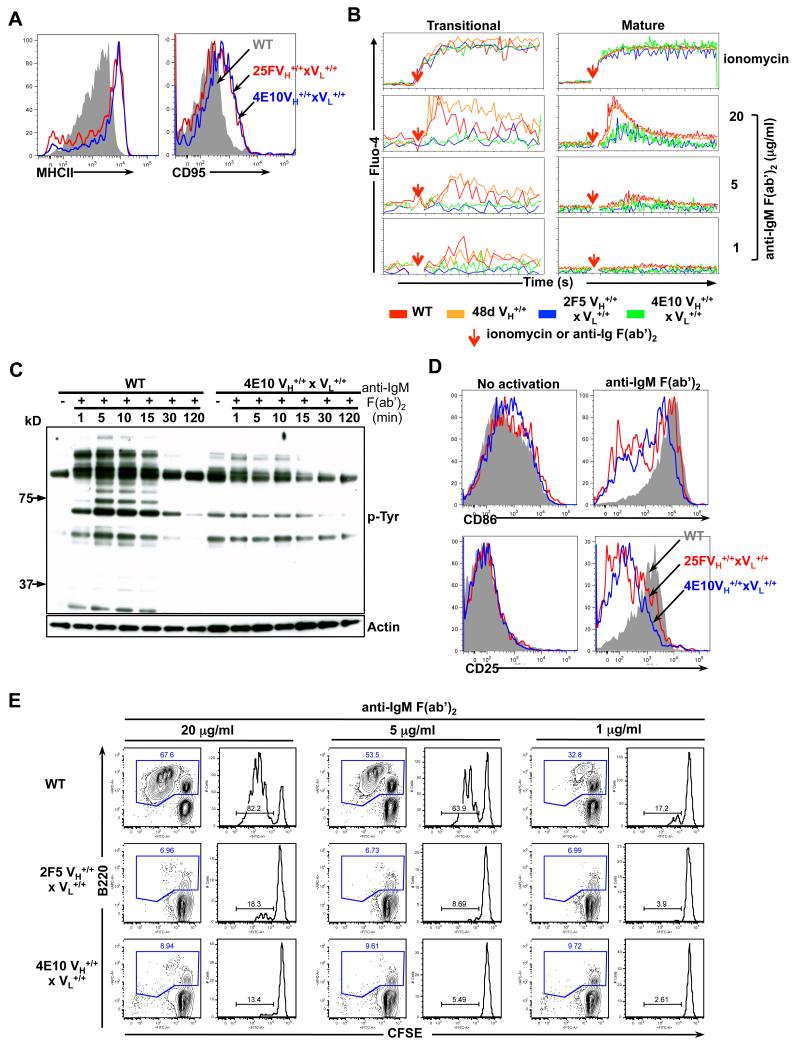
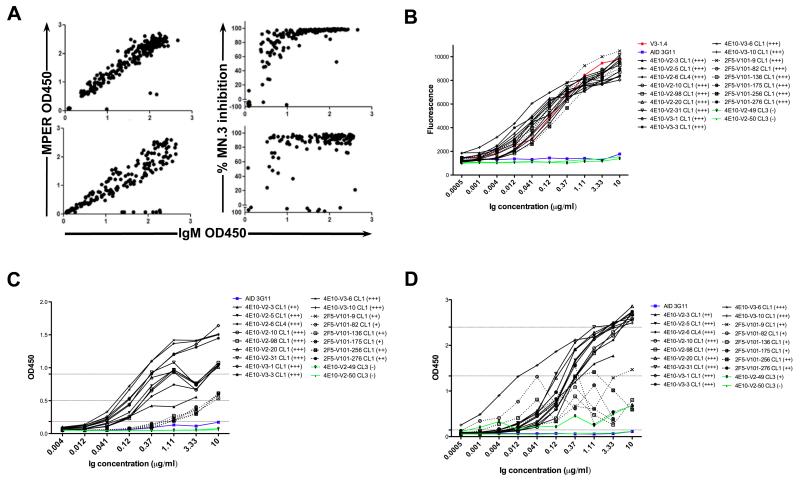
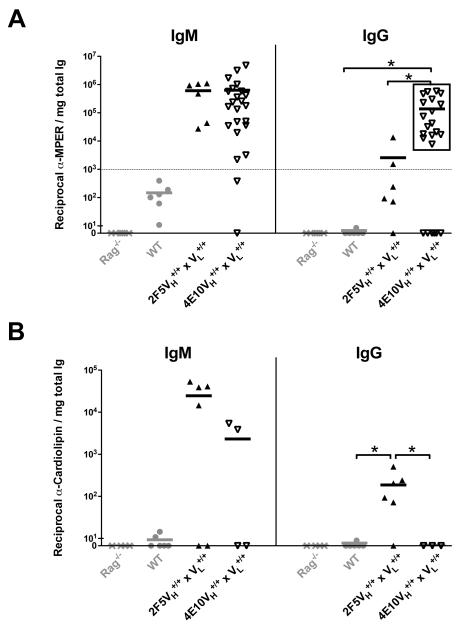
Developing an HIV-1 vaccine has been hampered by the inability of immunogens to induce broadly neutralizing Abs (BnAbs) that protect against infection. Previously, we used knockin (KI) mice expressing a prototypical gp41-specific BnAb, 2F5, to demonstrate that immunological tolerance triggered by self-reactivity of the 2F5 H chain impedes BnAb induction. In this study, we generate KI models expressing H chains from two other HIV-1 Abs, 4E10 (another self-/polyreactive, anti-gp41 BnAb) and 48d (an anti-CD4 inducible, nonpolyreactive Ab), and find a similar developmental blockade consistent with central B cell deletion in 4E10, but not in 48d VH KI mice. Furthermore, in KI strains expressing the complete 2F5 and 4E10 Abs as BCRs, we find that residual splenic B cells arrest at distinct developmental stages, yet exhibit uniformly low BCR densities, elevated basal activation, and profoundly muted responses to BCR ligation and, when captured as hybridoma mAb lines, maintain their dual (gp41/lipid) affinities and capacities to neutralize HIV-1, establishing a key role for anergy in suppressing residual 2F5- or 4E10-expressing B cells. Importantly, serum IgGs from naive 2F5 and 4E10 KI strains selectively eliminate gp41 and lipid binding, respectively, suggesting B cells expressing 2F5 or 4E10 as BCRs exhibit specificity for a distinct spectrum of host Ags, including selective interactions by 2F5 BCR(+) B cells (i.e., and not 4E10 BCR(+) B cells) with those mimicked by its gp41 neutralization epitope.


Figures

Figure 1
Figure 1. Targeted replacement of the mouse Igh and Igκ loci with the 4E10/48d VH(DH)JH and 4E10 VκJκ rearrangements, respectively
(A-B) Site-directed strategies used to knock-in VH and VL regions, respectively, showing the Ig targeting constructs, targeted Ig alleles (shown before and after homologous recombination) and the targeted alleles after Cre-mediated neo cassette deletion. Restriction fragment sizes are indicated for both wild-type and targeted loci. B=BamHI. N=NdeI. RV=EcoRV. Genotyping primers are denoted by arrows. A. Genomic structure of the targeted Igh allele, showing the endogenous mouse JH cluster and Cμ region, as well as the 4E10/48d VH expression cassette, comprised of a J558 H10 family promoter (p), the H10 split leader sequence (L), and the rearranged 4E10/48d VH(DH)JH (4E10/48dVH) coding segment. B. Genomic structure of the targeted endogenous mouse Jκ cluster and Cκ region, as well as the 4E10 VL expression cassette, comprised of a VκOx1 promoter (p), the VκOx1 split leader sequence (L), and the rearranged 4E10 VκJκ (4E10VL) coding segment.
Figure 2
Figure 2. Analysis of B-cell development and serum Ig subclass levels in C57BL/6 (WT), 4E10 VH+/+ and 48d VH+/+ KI strains
(A-C). Representative FACS contour histograms (representative of three experiments) comparing BM, splenic, and peritoneal B-cell development in 4E10 VH+/+ and 48d VH+/+ KI mice (expressing the somatically mutated H chains of the polyreactive, MPER-specific bnAb 4E10 and the non-neutralizing HIV-1 mAb 48d, respectively). Also shown as controls are WT (C57BL/6) littermates; all mice were 8-12 wk females. A. Analysis of BM B-cell subsets, either less differentiated subpopulations (upper panels), based on Hardy subfractionation, more differentiated subpopulations (middle panels), as revealed by surface IgM and IgD staining as previously described (32), or based on surface L chain κ and λ1-3 expression (lower panels). Indicated B-cell subsets were pre-gated as singlet, live lymphocytes (upper panels), or as singlet, live, total (CD19+B220+) B-cells (middle and lower panels), respectively. Numbers indicate percentages of B-cells in each subset, with subsets defined as follows: pro/pre=pro-B/large pre-B (fractions A-C’; B220loCD43+), small pre=small pre-B (fraction D; B220loCD43), imm/mat=mature+immature (fractions E-F; B220hiCD43); imm=immature (IgMint/hiIgD), T1/T2=transitional 1+2 (IgMhiIgDlo/int), and mat=mature (IgMintIgDhi). B. Analysis of splenic B-cell subpopulations, as revealed either by surface CD93 and CD23 expression of live lymphocytes (top row), and by surface CD21 and CD23 or IgM and IgD expression of live, total (CD19+B220+) B-cells (middle and lower rows, respectively). Numbers indicate percentages of B-cells in each gate, and B-cell subsets indicated in upper panels are defined as follows: T=transitional (B220+CD93+), Mat+MZ (B220+CD93), whereas those indicated in the middle row are defined as: NF=newly formed i.e. transitional (CD21CD23), MZ=marginal zone (CD23intCD21hi), and Mat=mature follicular B2 (CD23hiCD21int). C. Analysis of peritoneal B-cell subsets as revealed by surface staining of live lymphocytes with B220 and CD5 with numbers in each gate indicated, and B-cell subsets are defined as follows: B1a (B220intCD5int), B1b (B220intCD5), B2 (B220+CD5). D. Analysis of total Ig subclass levels in 4E10 VH+/+ and 48d VH+/+ KI mice, or WT (C57BL/6) littermates. Serum samples were collected from 6–12 wk female naïve mice, and serum concentrations for all Ig subclasses were determined by ELISA analysis. Each symbol represents an individual mouse and horizontal lines represent averages for each group. Significance values were determined using a two-tailed student test. NS: P>0.05, *P≤0.05, **P ≤0.01, ***p ≤0.001.
Figure 3
Figure 3. Flow cytometric comparison of BM B-cell development in C57BL/6 (WT), and 4E10/2F5 complete (VH+/+ × VL+/+) KI strains
Shown are FACS contour plot histograms (representative of three experiments) indicating frequencies of either: (A) less differentiated BM B-cell subsets (fractionated/annotated as indicated in Fig. 2A), (B) total (singlet/live/lymphocyte, CD19+B220+) BM B-cells, or (D) more differentiated BM B-cell subsets (fractionated/annotated as in Fig. 2A). Also shown is statistical analysis of (C) total BM B-cell frequencies, or (E) BM B-cell subset frequencies (based on flow cytometric gating shown in Figs. 3A and D, respectively), with each closed circle, closed triangle and open square representing individual 6-12 wk female naïve C57BL/6 (WT), 2F5 complete KI, and 4E10 complete KI mouse, respectively. Horizontal lines represent averages for each group. Significance values were determined using a two-tailed student test. NS: P>0.05, *P≤0.05, **P ≤0.01, ***p ≤0.001.
Figure 4
Figure 4. Distribution of splenic and peritoneal B-cell subsets in C57BL/6 (WT) and 4E10/2F5 complete (VH+/+ × VL+/+) KI strains
A. FACS contour plot histograms (representative of three experiments) showing frequencies of total (singlet/live/lymphocyte, B220+CD19+) B-cells in spleens of 6-12 wk naïve mice. B. Statistical analysis of total splenic B-cell percentages (based on flow cytometric analysis shown in Fig. 4A, with each circle, square and triangle representing an individual 6-12 wk C57BL/6 (WT), 2F5 complete KI, and 4E10 complete KI mouse, respectively. Horizontal lines represent averages for each group. Significance values were determined using a two-tailed student test. NS: P>0.05, *P≤0.05, **P ≤0.01, ***p ≤0.001. C. Representative FACS contour plot histograms showing analysis of splenic B-cell subsets derived from 8-12 wk female naïve mice, fractionated and annotated as indicated in Fig. 2B. D. Statistical analysis of splenic B-cell subsets from individual WT or 2F5/4E10 complete KI mice, represented either as frequencies of newly formed/transitional (CD21CD23), MZ (CD23intCD21hi), and Mat (CD23hiCD21int) subsets (upper panel) or transitional (B220+CD93+)/Mat+MZ (B220+CD93) ratios (lower panel). E. In vivo turnover of the predominant, transitional splenic B-cell subset in 4E10 complete KI mice. 8 wk naïve female naïve 4E10 complete KI or control C57BL/6 (WT) mice (lower and middle panels, respectively) were continuously labeled with BrdU for 4 days, prior to flow cytometric enumeration of the percent of BrdU+ B-cells within singlet/live, lymphocyte-gated transitional (B220+CD93+) and mature/MZ(B220+CD93) splenic B-cell subsets, as indicated in the shaded histograms. Also shown as negative controls are C57BL/6 (WT) mice without BrdU treatment (top panel). Data is representative of two mice/group. F. Representative FACS contour plot histograms showing analysis of peritoneal B-cell subsets as revealed by surface staining of live lymphocytes with B220 and either CD5 (upper row) or IgM (bottom row), with numbers in each gate indicated, and B-cell subsets indicated in the upper row are defined as for Fig. 2C. G. Analysis of total serum Ig subclass levels in C57BL/6 (WT) mice and 2F5/4E10 complete KI strains. Serum samples were collected from 6-12-wk naive mice, and Ig subclass concentrations were determined by Luminex analysis. Each symbol represents an individual mouse and horizontal lines represent averages for each group. H. Flow cytometric analysis of sIg densities in total (singlet/live/lymphocyte, B220+CD19+) splenic B-cells from 6-12 wk naïve mice, as measured by Median Fluorescence Intensity (MFI) quantifications of surface κL chain (left panel) or surface IgM (right panel) expression.
Figure 5
Figure 5. Phenotypic analysis of basal activation levels and functional analysis of signaling responses to in vitro BCR cross-linking in MPER bnAb KI splenic B-cells
A. Flow cytometric analysis of surface MHC class II and CD95 expression in naïve WT and 4E10 or 2F5 complete KI B-cells, represented as grey shadow and blue or red line histograms, respectively. B. Calcium flux analysis of control WT C57BL/6 or 48d VH KI and 2F5 or 4E10 complete KI B-cells (shown in red, orange, blue and green lines, respectively). Pre-stained splenocytes from naive mice were loaded with 1μM Fluo-4, and either baseline levels of calcium, or those in response to either ionomycin (used as a positive control) or anti-IgM F(ab’)2 stimulation were added (denoted by red arrows), were detected by flow cytometry in transitional (B220+CD93+) or mature (B220+CD93) B-cell subsets. C. Phosphorylated protein analysis of proximal signaling responses to in vitro BCR aggregation in purified WT or 4E10 complete KI splenic B cells, either incubated with medium alone (time=0) or stimulated with 20 μg/ml α-IgM F(ab’)2 for indicated times. Shown are either total phosphotyrosine protein levels, revealed by immunoblotting with the α-phosphotyrosine Ab 4G10 (upper panel) or total protein levels, revealed by re-probing the same blots with an actin-specific Ab (lower panel). (D-E). Distal signaling responses to in vitro BCR aggregation. D. Flow cytometric determination of surface expression of early/intermediate activation markers CD25 and CD86 in total naïve WT or 4E10 and 2F5 complete KI splenic B-cells (grey shadow or blue and red line histograms, respectively) either unstimulated (left panels) or in response to in vitro BCR crosslinking with 20 μg/ml α-IgM F(ab’)2 for 24h (right panels). E. Analysis of WT or 4E10 and 2F5 complete KI splenic B-cell proliferation after BCR aggregation as determined using a flow cytometric CFSE-based cell division assay. Splenocytes from naïve splenic B-cells were stimulated with 20, 5 or 1 μg/ml α-IgM F(ab’)2 with numbers in blue representing total (B220+) B-cell percentages, and those in right panels representing the percentage of dividing cells within the total (B220+) B-cell gate.
Figure 6
Figure 6. Antigenic reactivity and neutralization profiles of splenic hybridoma lines isolated from naïve 2F5 or 4E10 complete KI mice
A. MPER reactivity and HIV-1 neutralization profiles of B-cell hybridoma sub-cloned lines derived from primary screens of fusions using naïve 2F5 or 4E10 complete KI spleens. Data is represented as scatter plots, with MPER nominal epitope reactivities (left panels) or % MN.3 neutralization inhibition scores (right panels) plotted against supernatant IgM concentrations in 2F5 and 4E10 complete KI hybridoma lines (upper and lower panels, respectively). (B-D). Antigenic reactivity profiles of purified mAbs selected from primary screens. Shown are representative ELISA binding curves of purified 4E10 and 2F5 complete KI-derived mAbs (solid and dashed lines, respectively) to their (B) MPER neutralizing epitopes (as specified by MPR.03 peptides), (C) NIH-3T3 cytoplasmic/nuclear components, and (D) cardiolipin, all carried out as previously described (32). V3-1.4 (a 2F5 IgM mAb)(32) or 4E10-V2-6 CL4 (a representative 4E10 IgM mAb identified in this study, bearing 4E10 VH/VL sequences) and AID 3G11 (a non-neutralizing IgM mAb lacking self-polyreactivity) (69) were used as positive and negative controls for binding self-/polyreactive components, respectively. Criteria for positivity were arbitrarily set at saturating concentrations, and relative to control mAbs as follows: (+++) > 80% of (4E10-V2-6 CL4 or V3-1.4) binding, (++) = 50-80% of (4E10-V2-6 CL4 or V3-1.4) binding, and (+) = 25-50% of (4E10-V2-6 CL4 or V3-1.4) binding, but >AID 3G11 binding.
Figure 7
Figure 7. MPER epitope and lipid reactivities of serum Abs from naïve 2F5 and 4E10 KI strains
Shown are reciprocal endpoint titers of serum IgM and IgG-specific binding in 4E10 or 2F5 complete KI strains (grey and black rectangles, respectively) and control WT (C57BL/6) littermates or RAG1-deficient mice to (A) MPER 4E10/2F5 neutralization epitope-containing peptide MPR.03 or to (B) Cardiolipin (CL), with each rectangle representing an individual mouse and horizontal lines representing mean titers for each group. 4E10 complete KI mice having reciprocal α-MPER IgG >1000 were grouped as having “high MPER neutralization epitope reactivity” (framed in black rectangle) and compared with WT as well as 2F5 complete KI mice. For all indicated groups, serum samples were collected from 6-12 wk naïve and subjected to quantitative ELISA based on previous methods (32) and as described in Materials and Methods, with endpoint titers calculated as the reciprocal of the highest serum dilution used in which >3 background binding fluorescence were still observed. Data shown is normalized to the total IgM or IgG levels (mg/ml) shown in Fig 4D and S4A, respectively. Significance values were determined using a two-tailed student test. NS: P>0.05, *P≤0.05, **P ≤0.01, ***p ≤0.001.

Similar articles

Cited by

References

    1. McElrath MJ, Haynes BF. Induction of immunity to human immunodeficiency virus type-1 by vaccination. Immunity. 2010;33:542–554. - PMC - PubMed
    1. Mascola JR, Stiegler G, VanCott TC, Katinger H, Carpenter CB, Hanson CE, Beary H, Hayes D, Frankel SS, Birx DL, Lewis MG. Protection of macaques against vaginal transmission of a pathogenic HIV-1/SIV chimeric virus by passive infusion of neutralizing antibodies. Nature medicine. 2000;6:207–210. - PubMed
    1. Hessell AJ, Poignard P, Hunter M, Hangartner L, Tehrani DM, Bleeker WK, Parren PW, Marx PA, Burton DR. Effective, low-titer antibody protection against low-dose repeated mucosal SHIV challenge in macaques. Nature medicine. 2009;15:951–954. - PMC - PubMed
    1. Hessell AJ, Rakasz EG, Poignard P, Hangartner L, Landucci G, Forthal DN, Koff WC, Watkins DI, Burton DR. Broadly neutralizing human anti-HIV antibody 2 G12 is effective in protection against mucosal SHIV challenge even at low serum neutralizing titers. PLoS pathogens. 2009;5:e1000433. - PMC - PubMed
    1. Hessell AJ, Rakasz EG, Tehrani DM, Huber M, Weisgrau KL, Landucci G, Forthal DN, Koff WC, Poignard P, Watkins DI, Burton DR. Broadly neutralizing monoclonal antibodies 2F5 and 4E10 directed against the human immunodeficiency virus type 1 gp41 membrane-proximal external region protect against mucosal challenge by simian-human immunodeficiency virus SHIVBa-L. Journal of virology. 2010;84:1302–1313. - PMC - PubMed

Publication types

MeSH terms