. 2013 Aug 15;191(4):1517-28.
doi: 10.4049/jimmunol.1300486. Epub 2013 Jul 3.

STAT6 controls the number of regulatory T cells in vivo, thereby regulating allergic lung inflammation

Affiliations

STAT6 controls the number of regulatory T cells in vivo, thereby regulating allergic lung inflammation

Nicolas J Dorsey et al. J Immunol. .

Abstract

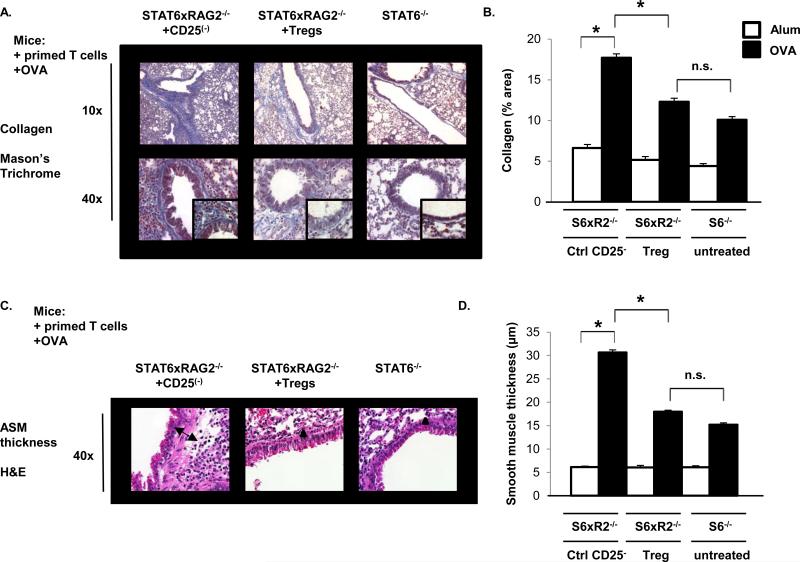
STAT6 plays a central role in IL-4-mediated allergic responses. Several studies indicate that regulatory T cells (Tregs) can be modulated by IL-4 in vitro. We previously showed that STAT6(-/-) mice are highly resistant to allergic lung inflammation even when wild-type Th2 effectors were provided and that they have increased numbers of Tregs. However, the role of STAT6 in modulating Tregs in vivo during allergic lung inflammation has not been thoroughly investigated. To examine Treg and STAT6 interaction during allergic inflammation, STAT6(-/-), STAT6xRAG2(-/-), and RAG2(-/-) mice were subjected to OVA sensitization and challenge following adoptive transfer of OVA-specific, wild-type Th2 effectors with or without prior Treg depletion/inactivation, using anti-CD25 (PC61). As expected, STAT6(-/-) mice were highly resistant to airway inflammation and remodeling. In contrast, allergic lung inflammation was partially restored in STAT6(-/-) mice treated with PC61 to levels observed in STAT6xRAG2(-/-) mice. In some cases, STAT6xRAG2(-/-) mice were also given natural Tregs along with Th2 effectors. Adoptive transfer of natural Tregs caused a substantial reduction in bronchoalveolar lavage eosinophil composition and suppressed airway remodeling and T cell migration into the lung in STAT6xRAG2(-/-) mice to levels comparable to those in STAT6(-/-) mice. These results demonstrate the STAT6-dependent suppression of Tregs in vivo to promote allergic airway inflammation.


Figures

Figure 1
Figure 1. Treg Depletion/ inactivation in STAT6−/− mice restores Th2-driven Airway Eosinophilia
(A) This study utilized an Allergic Airway Inflammation protocol in which STAT6−/− and STAT6×RAG2−/− mice received in vivo primed D011.10 CD4+ T cells (described in Materials and Methods) and were immunized twice with Alum or 100 μg OVA in Alum and challenged 6 days later with 1% aerosolized OVA in PBS. Additional STAT6−/− groups received two i.p. treatments of PC61 to deplete/ inactivate Tregs or control IgG 48h prior to each immunization. The mice were analyzed 48 h following the last challenge. Allergic airway inflammation was induced in STAT6−/− and STAT6×RAG2−/− mice as described above. Bronchoalveolar lavage was performed and the eosinophils in the BAL were analyzed by differential cell counting. The average percentage of eosinophils (B) and absolute number of eosinophils (C) are depicted here in bar graphs ± SEM (n=2-3 Alum-treated mice group, n=3-5 OVA-treated mice/group). *p<0.05; n.s. indicates non-statistical significance (p > 0.05).
Figure 2
Figure 2. Treg Depletion/ inactivation in STAT6−/− mice restores Th2-driven Allergic Lung Inflammation
Allergic airway inflammation was induced as described in Figure 1. Lung sections were stained with H&E. (A) The percentage of eosinophils surrounding airways or blood vessels was quantified by differential counting in 9-15 HPF/group. Percentages are represented graphically ± SEM (n=3-5 mice/ group). *p<0.05; n.s. indicates non-statistical significance (p > 0.05). HPF: high power field. Data is representative of three independent experiments. (B) Representative H&E images of lung sections from OVA-primed mice adjacent to the airway lumen (left) or bordering the pulmonary vasculature (right) are shown at 10x, 40x, and 100x. Arrow heads identify eosinophils surrounding the airway or lung vasculature.
Figure 3
Figure 3. Airway Remodeling in Treg-depleted/ inactivated STAT6−/− mice
STAT6−/− and STAT6×RAG2−/− mice were subjected to the allergic asthma protocol as described in Figure 1. (A) Masson's Trichrome stain was applied to paraffin embedded lung sections of each mouse. Collagen stains blue; keratin, muscle fibers, and erythrocytes stain red. The cytoplasm stains reddish pink. Collagen deposition is shown in photographs at magnifications of 10x, and 40x as indicated, and 100x. (B) NIH Image J software was used to quantify total collagen in the lung. The average percent area of collagen ± SEM (stains blue) is represented graphically. *p<0.001; n.s. indicates non-statistical significance (p > 0.001;n = 30-50 airways per group. (C) The airway smooth muscle (ASM) layer thickness was evaluated in of H&E stained lung sections from each mouse group (40x). The cross-sectional thickness of the ASM layer is delineated by arrows. (D) The transverse distance between the inner- and outermost border of the ASM layer was measured at 3 points adjacent to each airway using NIH Image J software analysis. The average diameter of airway smooth muscle layer thickness (μm ± SEM) is represented graphically. *p<0.001; n.s. indicates non-statistical significance (p > 0.001). n = 30-50 airways per group.
Figure 4
Figure 4. Treg depletion during the induction of allergic lung inflammation enhances CD3+ T- cell migration into the lung
STAT6−/− and STAT6×RAG2−/− mice were subjected to the allergic asthma protocol as described in Figure 1. Lung sections were stained with antibodies to CD3. (A) CD3+ cells appear brown in 10x, 40x, and 100x magnified representative images of lung sections from OVA-primed mice. (B) Graphical representation of immunohistochemistry data. The number of CD3+ cells in each lung section was quantified and graphed. Data represented as cell counts ± SEM. *p<0.05; n.s. indicates non-statistical significance (p > 0.05). HPF: high power field, 100x.
Figure 5
Figure 5. Adoptive transfer of nTregs into STAT6×RAG2−/− mice suppresses Th2-driven airway eosinophilia
(A) STAT6−/− and STAT6×RAG2−/− mice received in vivo primed D011.10 CD4+ Th2 effectors and were immunized twice with Alum or OVA/Alum and challenged with OVA on two occasions 6 days apart. STAT6×RAG2−/− mice also received CD4+CD25+ Tregs or CD4+CD25 T cells prepared from DO11.10×Foxp3-GFPKI at a 1:2 ratio with the Th2 effectors (1 Treg: 2 T eff). Experimental analysis was performed 48 h following the last challenge. (B) Allergic lung inflammation was induced in STAT6−/− and STAT6×RAG2−/− mice as described above. The STAT6×RAG2−/− mice received CD4+CD25+ nTregs or CD4+CD25 T-cells in addition to the Th2 effectors as indicated. Eosinophils in the BAL were analyzed by differential counting. The average percentage of eosinophils (B) and absolute number of eosinophils (C) are depicted here in bar graphs ± SEM (n=2-3 Alum-treated mice group, n=2-4 OVA-treated mice/group). *unpaired t-test p<0.05; n.s. indicates non-statistical significance (p > 0.05). (D) BAL fluid IL-5 was measured by ELISA. Data depicted in graphical representation ± SEM (n=2-4 mice/group) ¶ ANOVA single variance p<0.05; n.s. indicates non-statistical significance (p > 0.05).
Figure 6
Figure 6. Adoptive transfer of nTregs into STAT6×RAG2−/− mice suppresses Th2-driven Allergic Lung Inflammation
Allergic lung inflammation was induced in STAT6−/− and STAT6×RAG2−/− mice as described above. The STAT6×RAG2−/− mice received CD4+CD25+ nTregs or CD4+CD25 T-cells in addition to the Th2 effectors as indicated. Lung sections were stained with H&E. (A) The percentage of eosinophils surrounding airways or blood vessels was quantified by differential counting in 9-15 HPF/group. Percentages are represented graphically ± SEM (n=3-5 mice/group). *p<0.05; n.s. indicates non-statistical significance (p > 0.05). HPF: high power field. Data is representative of two independent experiments. (B) Representative H&E images of lung sections from OVA-primed mice adjacent to the airway lumen (left) or bordering the pulmonary vasculature (right) are shown at 10x, 40x, and 100x. Arrow heads identify eosinophils surrounding the airway or lung vasculature.
Figure 7
Figure 7. Airway Remodeling after the Transfer of Tregs into STAT6×RAG2−/− mice
STAT6−/− and STAT6×RAG2−/− mice were subjected to the allergic asthma protocol as described in Figure 4. (A) Masson's Trichrome stain was applied to paraffin embedded lung sections of each mouse. Collagen stains blue; keratin, muscle fibers, and erythrocytes stain red. The cytoplasm stains reddish pink. Collagen deposition is shown in representative photographs at magnifications of 10x, and 40x as indicated, and 100x (inset). (B) NIH Image J software was used to quantify total collagen in the lung. The average percent area of collagen ± SEM (stains blue is represented graphically. *p<0.001; n.s. indicates non-statistical significance (p > 0.001). n = 20-40 airways per group. (C) The airway smooth muscle (ASM) layer thickness was evaluated using H&E stained lung sections (40x) from each mouse group. The cross-sectional thickness of the ASM layer is illustrated by arrows. (D) The transverse distance between the inner- and outermost border of the ASM layer was measured at 3 points adjacent to each airway using NIH Image J software analysis. The average diameter of airway smooth muscle layer thickness (μm ± SEM) is represented graphically. *p<0.001; n.s. indicates non-statistical significance (p > 0.001). n = 30-50 airways per group.
Figure 8
Figure 8. Adoptive transfer of nTregs into STAT6×RAG2−/− mice suppresses CD3+ T-cell migration into the lung during Allergic Lung Inflammation
STAT6−/− and STAT6×RAG2−/− mice were subjected to the allergic asthma protocol as described in Figure 5. Lung sections were stained with antibodies to CD3. (A) CD3+ cells appear brown in 10x, 40x, and 100x magnified representative images of lung sections adjacent to the airway lumen from OVA-primed mice. (B) Graphical representation of immunohistochemistry data. The number of CD3+ cells in each lung section was quantified and graphed. Data represented as cell counts ± SEM. *p<0.05; n.s. indicates non-statistical significance (p > 0.05). HPF: high power field, 100x.

References

    1. Locksley RM. Asthma and allergic inflammation. Cell. 2010;140:777–783. - PMC - PubMed
    1. Perkins C, Wills-Karp M, Finkelman FD. IL-4 induces IL-13-independent allergic airway inflammation. The Journal of allergy and clinical immunology. 2006;118:410–419. - PubMed
    1. Robinson DS, Hamid Q, Ying S, Tsicopoulos A, Barkans J, Bentley AM, Corrigan C, Durham SR, Kay AB. Predominant TH2-like bronchoalveolar T-lymphocyte population in atopic asthma. The New England journal of medicine. 1992;326:298–304. - PubMed
    1. Wills-Karp M. Immunologic basis of antigen-induced airway hyperresponsiveness. Annual review of immunology. 1999;17:255–281. - PubMed
    1. Cohn L, Homer RJ, Marinov A, Rankin J, Bottomly K. Induction of airway mucus production By T helper 2 (Th2) cells: a critical role for interleukin 4 in cell recruitment but not mucus production. The Journal of experimental medicine. 1997;186:1737–1747. - PMC - PubMed

Publication types

MeSH terms