. 2014 Dec;24(12):3116-30.
doi: 10.1093/cercor/bht165. Epub 2013 Jul 3.

Characterizing thalamo-cortical disturbances in schizophrenia and bipolar illness

Affiliations

Characterizing thalamo-cortical disturbances in schizophrenia and bipolar illness

Alan Anticevic et al. Cereb Cortex. 2014 Dec.

Abstract

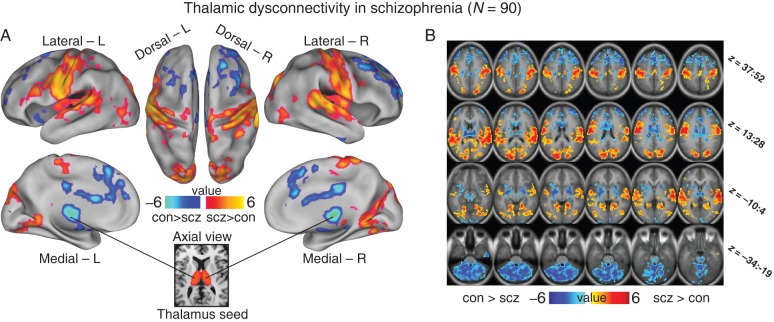
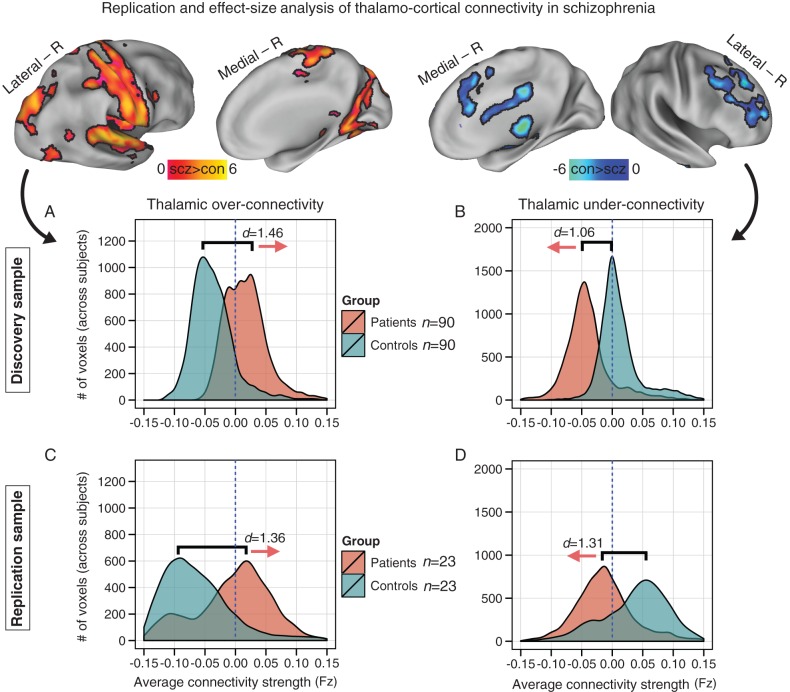
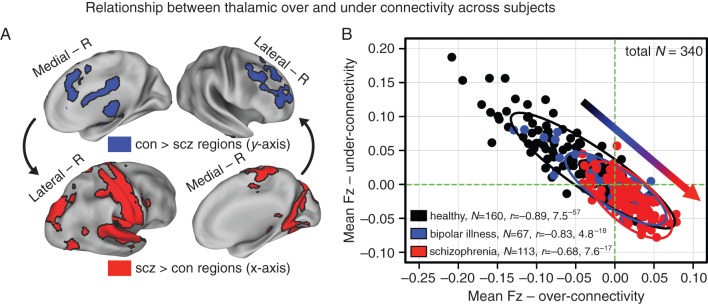
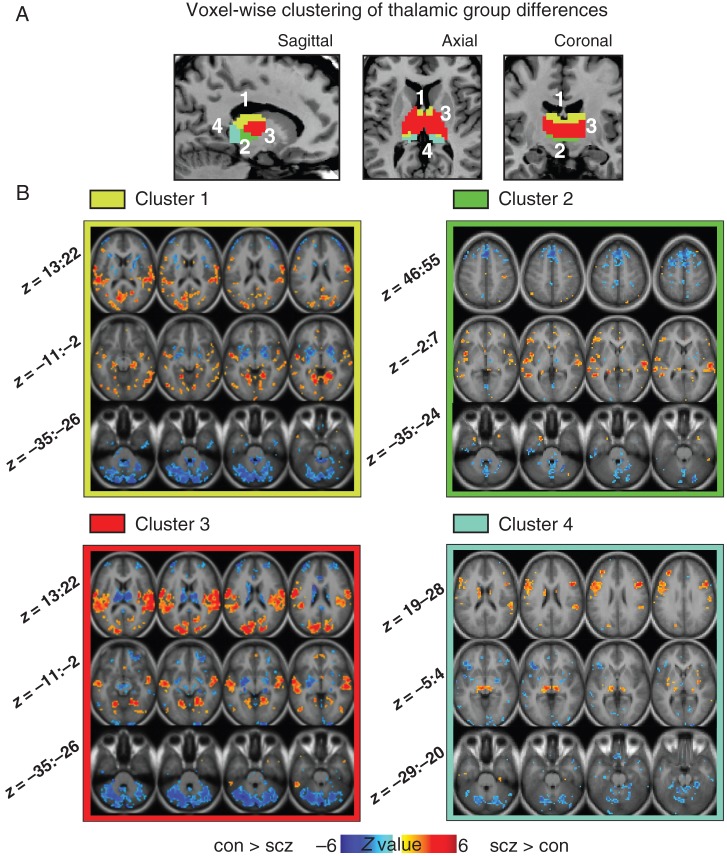
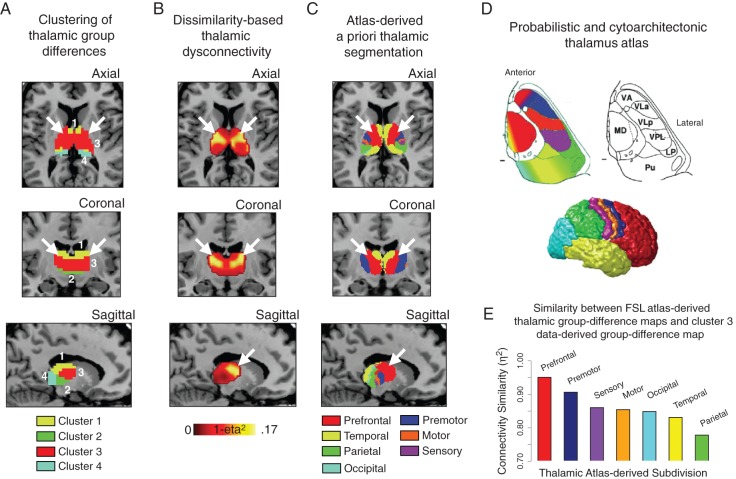
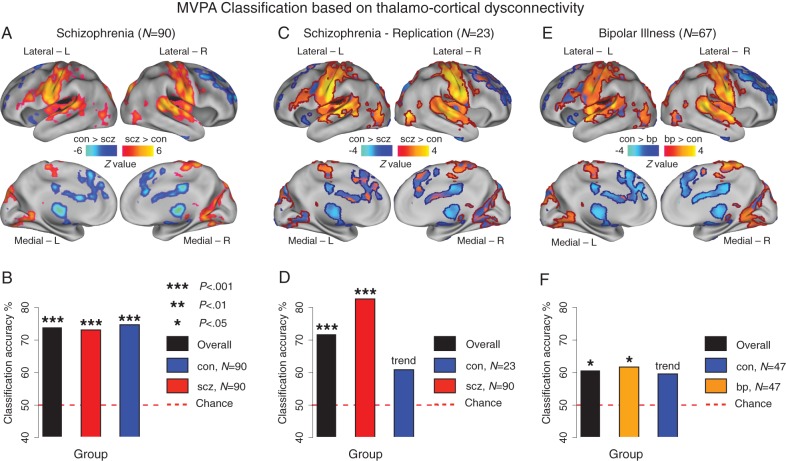
Schizophrenia is a devastating neuropsychiatric syndrome associated with distributed brain dysconnectivity that may involve large-scale thalamo-cortical systems. Incomplete characterization of thalamic connectivity in schizophrenia limits our understanding of its relationship to symptoms and to diagnoses with shared clinical presentation, such as bipolar illness, which may exist on a spectrum. Using resting-state functional magnetic resonance imaging, we characterized thalamic connectivity in 90 schizophrenia patients versus 90 matched controls via: (1) Subject-specific anatomically defined thalamic seeds; (2) anatomical and data-driven clustering to assay within-thalamus dysconnectivity; and (3) machine learning to classify diagnostic membership via thalamic connectivity for schizophrenia and for 47 bipolar patients and 47 matched controls. Schizophrenia analyses revealed functionally related disturbances: Thalamic over-connectivity with bilateral sensory-motor cortices, which predicted symptoms, but thalamic under-connectivity with prefrontal-striatal-cerebellar regions relative to controls, possibly reflective of sensory gating and top-down control disturbances. Clustering revealed that this dysconnectivity was prominent for thalamic nuclei densely connected with the prefrontal cortex. Classification and cross-diagnostic results suggest that thalamic dysconnectivity may be a neural marker for disturbances across diagnoses. Present findings, using one of the largest schizophrenia and bipolar neuroimaging samples to date, inform basic understanding of large-scale thalamo-cortical systems and provide vital clues about the complex nature of its disturbances in severe mental illness.

Keywords: bipolar illness; connectivity; resting state; schizophrenia; thalamus.


Figures

Figure 1.
Figure 1.
Thalamic dysconnectivity in schizophrenia. (A) Significant whole-brain between-group differences in thalamic connectivity between healthy controls (CON) and individuals with schizophrenia (SCZ). Red-orange foci mark areas where patients exhibited stronger thalamic coupling; blue foci mark areas where patients exhibited reduced thalamic coupling relative to healthy controls (Supplementary Tables 1 and 2 list all foci showing significant between-group differences). The bottom inset illustrates a thalamic seed. (B) Volume-based axial view with Z-coordinate ranges (each slice in each row increments by 3 mm). For group-specific unthresholded connectivity patterns see Supplementary Figure 1; and for comprehensive between-group contrasts across samples see Supplementary Figures 2 and 4. For a formal conjunction analysis with a priori-defined sensory–motor networks see Supplementary Figure 12.
Figure 2.
Figure 2.
Replication and effect-size analysis of thalamo-cortical connectivity in schizophrenia. Top panels show increased (left) versus reduced (right) thalamic coupling in schizophrenia. Distributions of average connection strengths for each voxel showing (A) increased and (B) reduced thalamic coupling in schizophrenia. (C and D) Independently diagnosed replication sample. Effect sizes (Cohen's d) indicate robust effects across samples. Blue vertical dashed lines mark the zero point, highlighting increased thalamic coupling with sensory–motor networks and decreased coupling with prefrontal–striatal and cerebellar regions for patients. Supplementary Figure 3 shows distributions for the bipolar sample; Supplementary Figure 4 shows schizophrenia versus bipolar contrast maps.
Figure 3.
Figure 3.
Relationship between thalamic over- and under-connectivity across subjects. (A) Regions showing reduced (blue, top panel) and increased (red, bottom panel) thalamic connectivity for the original discovery sample (N = 90). (B) A significant negative relationship evident across all healthy controls (gray-black data points, N = 160; r = −0.89, P < 7.5−57) collapsing across all 3 samples (discovery, replication, and healthy controls matched to bipolar patients). The same pattern was evident for bipolar patients (blue data points, N = 67; r = −0.83, P < 4.8−18), whereas an attenuated and shifted correlation was found for schizophrenia patients (red data points, N = 113; r = −0.68, P < 7.6−17, collapsing across both discovery and replication samples). Vertical/horizontal green lines mark the zero points. Schizophrenia patients showed a “shift” across the zero lines, indicative of weaker prefrontal–cerebellar–thalamic coupling, but stronger sensory–motor–thalamic coupling. Bipolar patients showed an intermediate degree of disruption, suggesting a “gradient” (inset arrow for qualitative illustration). Ellipses for each group mark the 95% confidence interval. Supplementary Figures 6 and 7 show sample-specific analyses.
Figure 4.
Figure 4.
Voxel-wise clustering of group differences in thalamic connectivity. (A) Results of 4-cluster solution identifying thalamic voxels with similar patterns of whole-brain connectivity differences between groups (see Supplementary Fig. 8 for workflow and Supplementary Fig. 9 for a 6-cluster solution). (B) Between-group difference maps when a given cluster is used as a seed. The pattern of between-group differences for cluster 3 (red) was qualitatively most similar to main effects (see Fig. 1), which roughly corresponds to higher-order associative thalamic nodes (Behrens et al. 2003). Z-coordinates as in Figure 1.
Figure 5.
Figure 5.
Intrinsic thalamic dysconnectivity in schizophrenia. (A) Results of 4-cluster solution identifying thalamic voxels with similar patterns of whole-brain connectivity differences between groups (as in Fig. 4). (B) Intrinsic thalamic dysconnectivity pattern based on group dissimilarity (1 − η2) (Jenkinson et al. 2012). Brightest voxels are associated with highest between-group differences. (C) Thalamus subdivisions based on the FSL thalamic atlas, to facilitate the comparison of data-driven dysconnectivity relative to the anatomy. White arrows show the correspondence across results for thalamic nodes with strong PFC connectivity. (D) Adapted with permission (Smith and Nichols 2009), to allow inspection of thalamic segmentation in comparison to between-group findings: (top-left), thalamic nuclei color-coded based on the major cortical connection site, (top-right) cytoarchitectonic atlas subdivisions (Saad et al. 2012), and (bottom) cortical sectors showing different patterns of thalamic anatomical connectivity. (E) Quantitative comparison of similarity (η2) between each anatomically based between-group differences map and cluster 3 from panel A. We used an FSL-based atlas-derived seeds across thalamic nuclei (independent of this sample altogether) to compute a group difference map. We then quantified how similar each atlas-derived seed result was to those identified from the medio-dorsal cluster in our data (to be distinguished from any anatomy-based analyses that are defined based on subject-specific data in the current sample). For all atlas-derived maps of between-group differences see Supplementary Figure 10; for similarity matrix comparing 4- and 6-cluster solutions relative to independent atlas-derived subdivisions see Supplementary Figure 11.
Figure 6.
Figure 6.
MVPA classification based on thalamo-cortical dysconnectivity. (A) As in Figure 1, schizophrenia (SCZ) results used to train the classifier. (B) Discovery sample results showing above-chance classification accuracy. (C) Between-group map for the SCZ replication sample (N = 23), shown unthresholded, masked with regions from panel A (to allow inspection relative to original findings). Red and blue borders mark whole-brain corrected increased and decreased thalamic connectivity, respectively, identified in the original SCZ sample. (D) SCZ replication classification. (E) Between-group difference map for bipolar patients (N = 67), again shown unthresholded, masked with panel A regions and surrounded by borders. (F) Bipolar disorder (BP) and control (CON) classification. For comprehensive visualization of volume-based type I error corrected group differences and unthresholded surface group contrast maps across samples, see Supplementary Figs 1, 2, and 4. Of note, sensitivity and specificity were 75.5 and 72.2, respectively, for the discovery sample and 67.9 and 77.8 for the replication sample.

References

    1. Alexander GE, DeLong MR, Strick PL. Parallel organization of functionally segregated circuits linking basal ganglia and cortex. Annu Rev Neurosci. 1986;9:357–381. - PubMed
    1. Andreasen NC. The role of the thalamus in schizophrenia. Can J Psychiatry. 1997;42:27–33. - PubMed
    1. Andreasen NC, Arndt S, Swayze V, Cizadlo T, Flaum M, O'Leary D, Ehrhardt JC, Yuh WTC. Thalamic abnormalities in schizophrenia visualized through magnetic resonance image averaging. Science. 1994;266:294–298. - PubMed
    1. Andreasen NC, Pressler M, Nopoulos P, Miller D, Ho B-C. Antipsychotic dose equivalents and dose-years: a standardized method for comparing exposure to different drugs. Biol Psychiatry. 2010;67:255–262. - PMC - PubMed
    1. Anticevic A, Brumbaugh MS, Winkler AM, Lombardo LE, Barrett J, Corlett PR, Kober H, Gruber J, Repovs G, Cole MW, et al. Global prefrontal and fronto-amygdala dysconnectivity in bipolar I disorder with psychosis history. Biol Psychiatry. 2012;73:565–573. - PMC - PubMed

Publication types