. 2013 Jul 3;33(27):11169-83.
doi: 10.1523/JNEUROSCI.4704-12.2013.

Palmitoylation of amyloid precursor protein regulates amyloidogenic processing in lipid rafts

Affiliations

Palmitoylation of amyloid precursor protein regulates amyloidogenic processing in lipid rafts

Raja Bhattacharyya et al. J Neurosci. .

Abstract

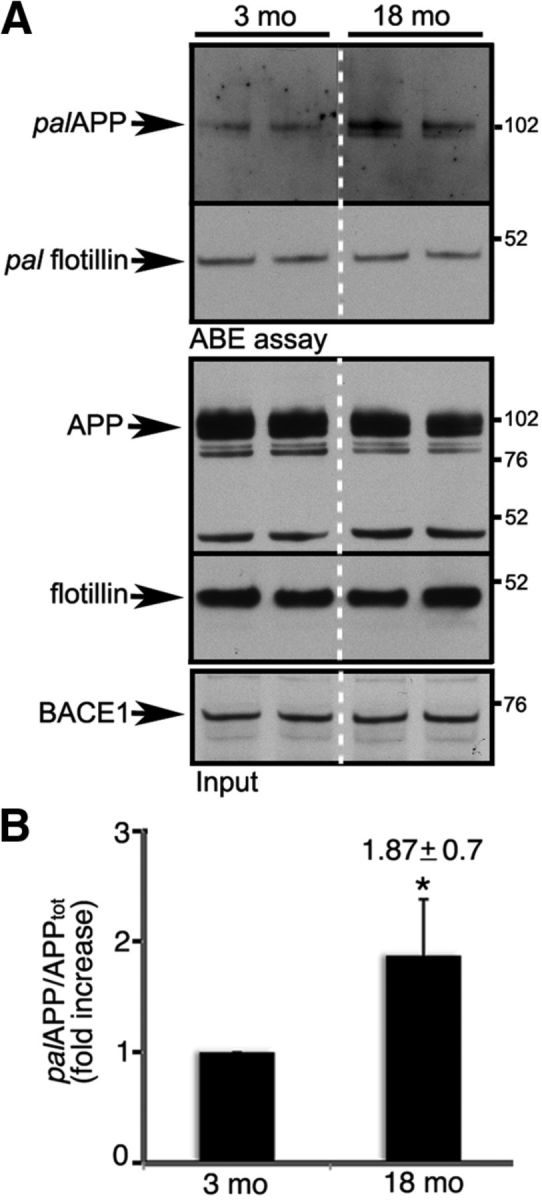
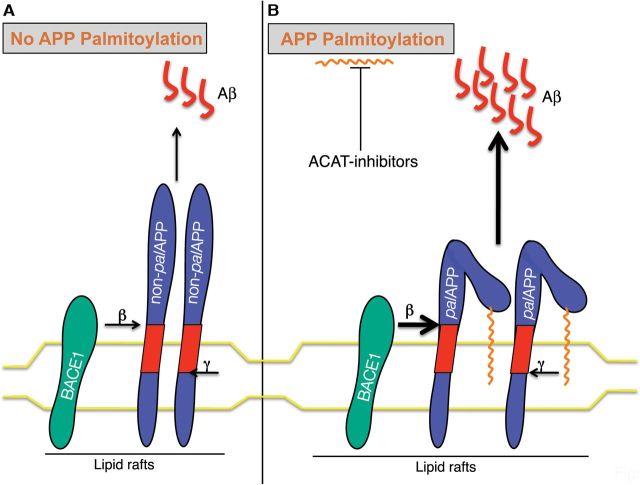
Brains of patients affected by Alzheimer's disease (AD) contain large deposits of aggregated amyloid β-protein (Aβ). Only a small fraction of the amyloid precursor protein (APP) gives rise to Aβ. Here, we report that ∼10% of APP undergoes a post-translational lipid modification called palmitoylation. We identified the palmitoylation sites in APP at Cys¹⁸⁶ and Cys¹⁸⁷. Surprisingly, point mutations introduced into these cysteines caused nearly complete ER retention of APP. Thus, either APP palmitoylation or disulfide bridges involving these Cys residues appear to be required for ER exit of APP. In later compartments, palmitoylated APP (palAPP) was specifically enriched in lipid rafts. In vitro BACE1 cleavage assays using cell or mouse brain lipid rafts showed that APP palmitoylation enhanced BACE1-mediated processing of APP. Interestingly, we detected an age-dependent increase in endogenous mouse brain palAPP levels. Overexpression of selected DHHC palmitoyl acyltransferases increased palmitoylation of APP and doubled Aβ production, while two palmitoylation inhibitors reduced palAPP levels and APP processing. We have found previously that acyl-coenzyme A:cholesterol acyltransferase (ACAT) inhibition led to impaired APP processing. Here we demonstrate that pharmacological inhibition or genetic inactivation of ACAT decrease lipid raft palAPP levels by up to 76%, likely resulting in impaired APP processing. Together, our results indicate that APP palmitoylation enhances amyloidogenic processing by targeting APP to lipid rafts and enhancing its BACE1-mediated cleavage. Thus, inhibition of palAPP formation by ACAT or specific palmitoylation inhibitors would appear to be a valid strategy for prevention and/or treatment of AD.


Figures

Figure 1.
Figure 1.
APP is palmitoylated. A, Confocal microscopy of palmitoylated proteins in CHOAPP cells after metabolic labeling with (+) or without (−) Alkyl-C16 followed by alkyne-TAMRA incorporation. APP distribution is detected by immunostaining with anti-V5 antibody (APP). Merged images show colocalization. Scale bar, 10 μm. B, Palmitoylated APP from CHOAPP cells metabolically labeled with Alkyl-C16 (left). The palmitoylation inhibitor 2-bromopalmitate (Alkyl-C16 plus 2-BP) prevented incorporation of Alkyl-C16 into APP. APPm, Mature APP; APPim, immature APP. C, Top, Fluorography of palmitoylated APP after metabolic labeling of CHOAPP cells with 100 μm [3H]-palmitic acid ([3H]-C16) and immunoprecipitation with an anti-APP C-terminal antibody (C66). Bottom, Total input of APP. D, Left, ABE assay showing palAPP, pal-flotillin, and pal-BACE1, not found in the negative control lacking (−) NH2OH (left). Right, Total input. E, ABE assay detected mature and immature palAPP in naive CHO, H4, and B104 cells (top). F, Top, Detection of mature and immature palAPP in 3-month-old mouse brain extracts by mABE assay. Bottom, Total immunoprecipitated APP.
Figure 2.
Figure 2.
Cys186 and Cys187 are required for effective palmitoylation and ER exit of APP. A, Schematic representation of APP splice variants, APP751 and APP695, and N-terminal deletion mutants, APPΔ281 and APPΔ343. B, Left, ABE assay showing palmitoylation of APP751 and APP695, but not of APPΔ281 and APPΔ343. Right, APP protein loads for each assay. Asterisks represent endogenous APP. C, Quantitative analysis of B and two additional experiments, expressed as percentage of palmitoylation compared to APP751. **p < 0.01. D, Top, APP Cys186 and/or Cys187 mutants stably expressed in CHO cells are not palmitoylated in ABE assays. Bottom, Severely reduced maturation and α- and β-CTF generation by the Cys mutants. APP CTFs were overexposed with respect to full-length APP. E, OptiPrep density gradient subcellular fractionation shows nearly complete ER retention of the APP(C186,187S) mutant. ER and Golgi fractions were detected by calreticulin and GM130 stainings, respectively. F, a–f, Indirect immunofluorescence analysis confirms predominant ER (calreticulin positive) localization of the APP(C186,187S) mutant. Scale bar, 10 μm. G, Conditioned media from indicated cells were subjected to sandwich ELISA to determine amyloid (Aβ40 and Aβ42) release from the cells. H, Additional Cys186 and/or Cys187 mutants show lack of APP maturation. I, Partial amino acid sequence of APP's cysteine-rich domain, showing the known Cys186–Cys158 and Cys187–Cys133 disulphide bridges (S–S). J, Top, APP Cys133 and/or Cys158 mutants show increased palmitoylation in an ABE assay performed on CHO cells transiently transfected with expression plasmids. Bottom, Maturation and CTF generation of the mutants.
Figure 3.
Figure 3.
palAPP is enriched in lipid rafts. A, Lipid raft fractionation of CHOAPP cell Lubrol extracts on a discontinuous sucrose gradient. APP is stained with a C-terminal antibody (C66). B, ABE assay on raft (3 and 4) and nonraft (9 and 10) fractions normalized for full-length APP amounts (left, Total input), illustrating increased palAPP levels in rafts compared to nonrafts (right, ABE). C, Quantitation of B and two additional experiments, showing palAPP in raft fractions compared to non-aft fractions relative to total APP. D, Lipid raft fractionation of mouse brain Lubrol extracts. Rafts, Flotillin positive; nonrafts, flotillin negative. E, ABE assay on mouse brain raft and nonraft fractions show increased palAPP levels in lipid rafts. Representative of triplicate experiments performed on raft and nonraft fractions isolated separately from two non-Tg mice. F, Quantitation of E. Error bars show the SEM.
Figure 4.
Figure 4.
DHHC-7 and DHHC-21 PATs palmitoylate APP. A, ABE assay shows increased palAPP and α- and β-CTF levels upon expression of HA-DHHC-7 and HA-DHHC-21, but not by expression of HA-DHHC-1 (ABE assay and IB: C66) in CHOAPP cells. Similarly, expression of HA-DHHC-7 and HA-DHHC-21 also increased palAPP and α- and β-CTF levels in PC-12 cells. Levels of the control GAPDH were unaffected. B, Aβ ELISA demonstrates increased levels of secreted Aβ40 and Aβ42 in the conditioned media isolated from cells (CHOAPP and PC-12) expressing HA-DHHC-7 and HA-DHHC-21. HA-DHHC-1 expression shows no effect on Aβ release from CHOAPP cells. Cells transfected with empty vectors (EV) were used as a control.
Figure 5.
Figure 5.
palAPP is a better substrate for BACE1 than α-secretase. A, Detection of pal-sAPPβ and pal-sAPPα in the conditioned media from CHOAPP and CHOAPP+BACE1 cells (ABE assay). The assay was performed after treating the cells without (Vehicle) or with 5 μm BACEi IV (BACEi IV) for 16 h. Bottom, Total levels of sAPPβ and sAPPα [Total Input (10%)]. ABE assay of the control (Vehicle) conditioned media is the representation of three separate experiments. B, Quantitation of the control (Vehicle) ABE assays from A. **p < 0.01; Error bars indicate SEM. C, Top, ABE assay of equal amounts of cell lysates shows reduced full-length palAPP in CHOAPP+BACE1 compared to that from CHOAPP (a), indicating increased BACE1-mediated cleavage of palAPP upon BACE1 expression. Palmitoylated flotillin (b) levels remain unchanged in both cells, and palmitoylated BACE1 (c) was detected in CHOAPP+BACE1 cells. Bottom, Total input shows increased βCTF (C99 and perhaps C89) in CHOAPP+BACE1 cells, but no significant changes in holo-APP (d). Total flotillin (e) and BACE1 (f) are also shown. D, Quantitation of C. Error bars are the SEM of three separate experiments. E, ABE assay of cells treated with 5 μm BACEi IV, 5 μm dr9 (dr9), or 20 μm α-secretase inhibitor (TAPI) demonstrates increased levels of palAPP upon BACE inhibition (BACEi IV or dr9), but not α-secretase inhibition (TAPI; top, ABE assay, IB: anti-APP). Pal-flotillin levels remain unchanged (palFlotillin, IB: anti-flotillin). Changes in sAPPβ and sAPPα levels show effective BACE and α-secretase inhibition, respectively. F, Palmitoylation of newly synthesized APP (palAPPm and palAPPim) analyzed by CHX block/release assay. APPm, Mature APP; APPim, immature APP. Top, BACEi IV increased newly synthesized full-length palAPPm and palAPPim in a dose-dependent manner (ABE assay). The bottom panel shows a decrease in βCTF level upon increasing BACEi IV without affecting holo-APP (APPm and APPim) levels. The figure is representative of three separate experiments. G, Graphical representation of the palAPP fold increase (red) and βCTF fold decrease (blue) of F. The error bars are the SEM of three independent experiments. H, Postnuclear homogenates of CHOAPP+BACE1 were fractionated in 7.5–30% OptiPrep density gradients to separate ER and post-ER fractions. Fractions were analyzed for APP (top, APPm and APPim), myc-epitope tagged BACE1 (middle), and the ER-marker calreticulin (bottom).
Figure 6.
Figure 6.
BACE1 cleaves palAPP in vivo. A, C, Increased full-length palAPP levels upon BACE inhibition in primary neurons. Primary neurons generated from nontransgenic mice were incubated with DMSO (veh) or the BACE inhibitors BACEi IV (Inh IV) or dr9 for 16 h before ABE assay (A) or metabolic labeling with Alkyl-C16 (C). B, Quantitation of palAPP fold increase upon Inh IV-treatment as in A. Error bars represent the SEM of three independent experiments. C, TAMRA-labeled palAPP was detected by immunoblotting (IB: anti-TAMRA, palAPP). D, Increased full-length mature palAPP levels in cortices of BACE1-knock out (BACE1−/−) mice compared to control (WT). palAPP was measured by performing duplicate mABE assays (a) on equal amounts of immunoprecipitated APP (b). An anti-BACE1 antibody detected no BACE1 expression in total extract from BACE−/− mice (c). E, Quantitation of C. APPTot, mature APP (APPm) plus immature APP (APPim). *p < 0.05; ** p < 0.01. n = 3 for each genotype. Error bar represent the SEM. CM, Conditioned media.
Figure 7.
Figure 7.
Palmitoylation appears to increase BACE1-mediated cleavage of APP in lipid rafts. A, In vitro BACE1 cleavage assay shows that palAPP in CHOAPP cell lipid raft fractions is a good BACE1 substrate. pal-sAPPβ, sAPPβ, and sAPPα are shown. This is a representative figure of three independent experiments. B, Quantitation of A. Data represent the average of three independent experiments. **p < 0.01. Error bars represent the SEM of three experiments. C, In vitro BACE cleavage assay on lipid rafts isolated from mouse brains confirms that endogenous brain lipid raft palAPP is a good BACE1 substrate, better than total APP in our in vitro BACE cleavage assays.
Figure 8.
Figure 8.
Accumulation of cortical palAPP in older nontransgenic mice. A, ABE assay of cortical extracts from 3- and 18-month-old mice. palAPP levels are higher in 18- versus 3-month-old mice, while pal-flotillin levels remain unchanged. Total input of APP, flotillin, and BACE1 were detected with the anti-APP (C66), anti-flotillin, and anti-BACE1 antibodies, respectively. The APP band below 52 kDa is aspecific. B, Quantitation of palAPP levels in relation to total APP (palAPP/APPtot) from A. *p < 0.05. n = 3 of each age group. Assays were performed in duplicate. Error bars represent the SEM.
Figure 9.
Figure 9.
Palmitoylation inhibitors or ACAT inhibitors reduce APP palmitoylation and APP processing. A, ABE assay of CHOAPP cells after treatment with the indicated amounts of palmitoylation inhibitors, 2-BP or cerulenin (Cer). Both inhibitors reduced palAPP and APP CTF levels at concentrations of 50 μm or more. B, ACAT inhibition decreases APP palmitoylation. ABE assay showing severe reduction in palAPP levels in ACAT-inactive AC29APP cells compared to CHOAPP cells. Similarly, treatment of CHOAPP cells with 10 μm ACAT inhibitor CP-113,818 (CP) reduced full-length palAPP compared to control (veh; ABE assay). Levels of α- and β-CTFs were significantly reduced in AC29APP cells and CP-treated cells (input). C, Concentration-dependent reduction in palAPP levels by increasing concentrations of the ACAT inhibitor CI-1011 (ABE assay in CHOAPP cells). CI-1011 (10 μm) also reduced β- and α-CTF production (input). Levels of pal flotillin are also shown. D, Quantitation of C. CI-1011 (10 μm) induces an ∼57% reduction in palAPP levels. **p < 0.05. n = 3 for each set of experiment. Error bars represent the SEM. E, Lipid rafts fractionation of Lubrol extracts of CHOAPP cells treated with DMSO vehicle (+veh) or 10 μm CI-1011 (+CI-1011) for 4 d showed no significant alteration in APP distribution in raft versus nonraft fractions. F, CI-1011-treated cells showed significant reduction in raft-associated palAPP. Rafts and nonrafts from untreated (Veh) or CI-1011-treated cells were collected and subjected to ABE analysis to detect palAPP or pal-flotillin.
Figure 10.
Figure 10.
Schematic representation of APP palmitoylation modulating APP processing and Aβ generation in lipid rafts. A, No APP palmitoylation. BACE1 (green) in lipid rafts cleaves APP at the β-cleavage site. Subsequent γ-secretase mediated cleavage (γ) generates Aβ (red). B, APP palmitoylation. APP is palmitoylated, shown as the palmitic moiety (orange) attached to APP (palAPP), and recruited to lipid rafts. Our data suggest that palmitoylation may enhance BACE1-mediated cleavage of APP (bold arrow). The final effect is an increased generation of Aβ. ACAT inhibition attenuates APP palmitoylation, and in turn reduces Aβ generation.

References

    1. Barnham KJ, McKinstry WJ, Multhaup G, Galatis D, Morton CJ, Curtain CC, Williamson NA, White AR, Hinds MG, Norton RS, Beyreuther K, Masters CL, Parker MW, Cappai R. Structure of the Alzheimer's disease amyloid precursor protein copper binding domain. A regulator of neuronal copper homeostasis. J Biol Chem. 2003;278:17401–17407. doi: 10.1074/jbc.M300629200. - DOI - PubMed
    1. Barrett PJ, Song Y, Van Horn WD, Hustedt EJ, Schafer JM, Hadziselimovic A, Beel AJ, Sanders CR. The amyloid precursor protein has a flexible transmembrane domain and binds cholesterol. Science. 2012;336:1168–1171. doi: 10.1126/science.1219988. - DOI - PMC - PubMed
    1. Bhattacharyya R, Kovacs DM. ACAT inhibition and amyloid beta reduction. Biochim Biophys Acta. 2010;1801:960–965. doi: 10.1016/j.bbalip.2010.04.003. - DOI - PMC - PubMed
    1. Bhattacharyya R, Wedegaertner PB. G alpha 13 requires palmitoylation for plasma membrane localization, Rho-dependent signaling, and promotion of p115RhoGEF membrane binding. J Biol Chem. 2000;275:14992–14999. doi: 10.1074/jbc.M000415200. - DOI - PubMed
    1. Bodovitz S, Klein WL. Cholesterol modulates alpha-secretase cleavage of amyloid precursor protein. J Biol Chem. 1996;271:4436–4440. doi: 10.1074/jbc.271.8.4436. - DOI - PubMed

Publication types

Substances