. 2013 Jul 3;33(27):11262-75.
doi: 10.1523/JNEUROSCI.5867-12.2013.

Transcranial alternating current stimulation modulates large-scale cortical network activity by network resonance

Affiliations

Transcranial alternating current stimulation modulates large-scale cortical network activity by network resonance

Mohsin M Ali et al. J Neurosci. .

Abstract

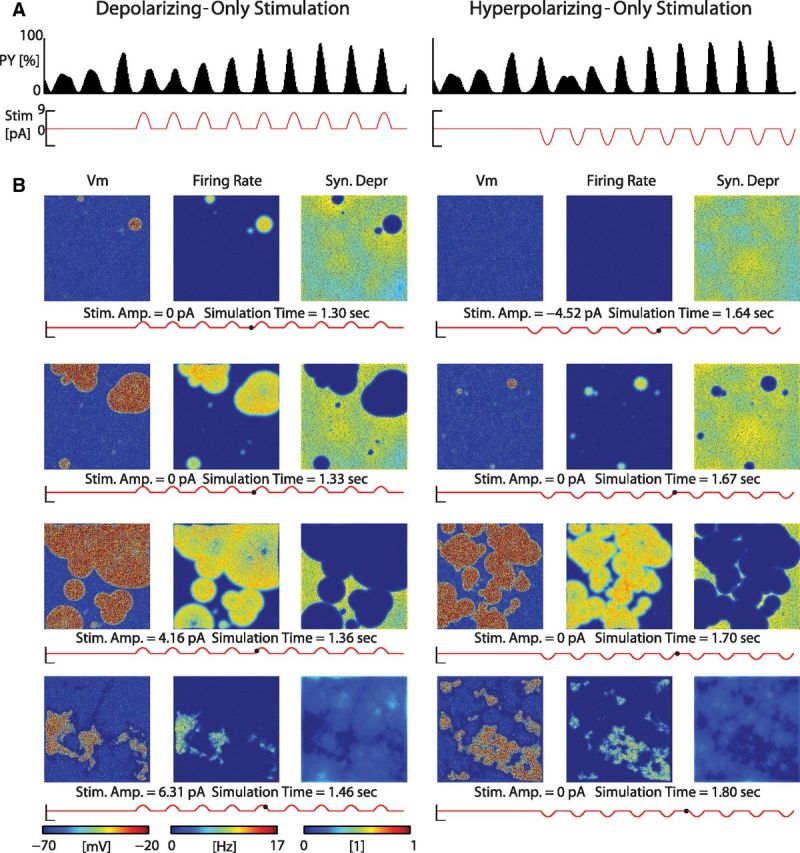
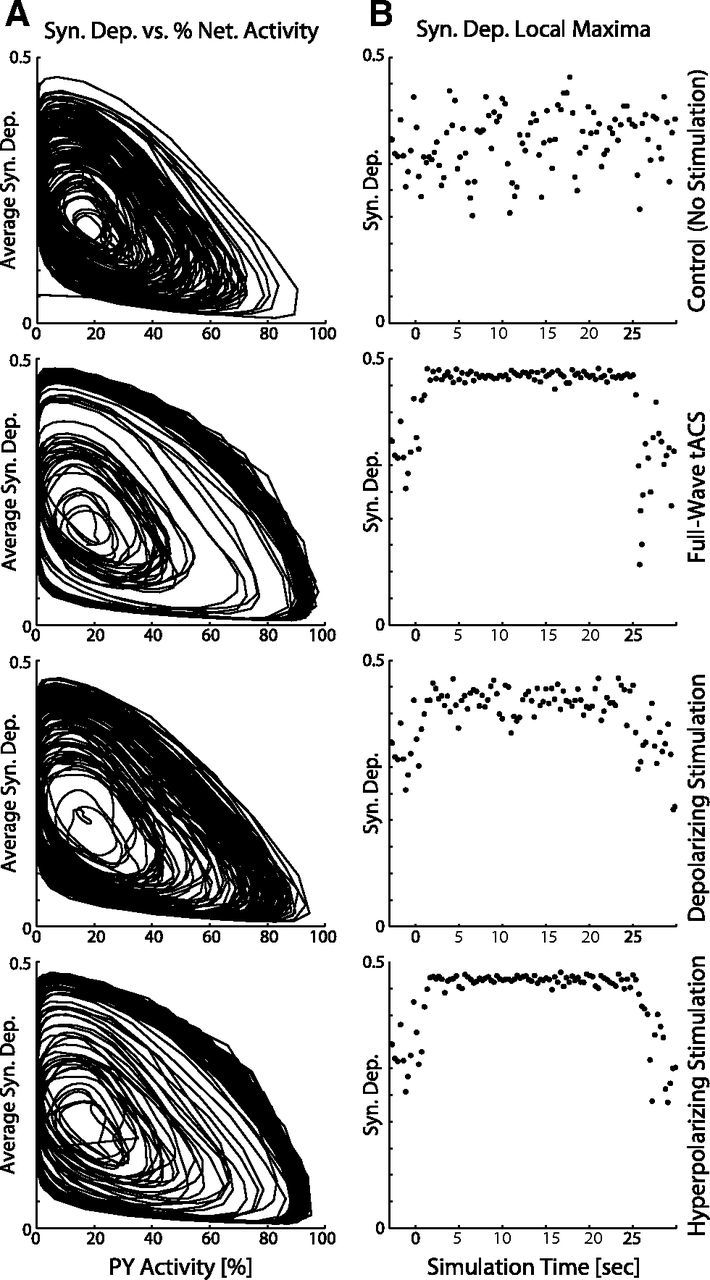
Transcranial direct current stimulation (tDCS) has emerged as a potentially safe and effective brain stimulation modality that alters cortical excitability by passing a small, constant electric current through the scalp. tDCS creates an electric field that weakly modulates the membrane voltage of a large number of cortical neurons. Recent human studies have suggested that sine-wave stimulation waveforms [transcranial alternating current stimulation (tACS)] represent a more targeted stimulation paradigm for the enhancement of cortical oscillations. Yet, the underlying mechanisms of how periodic, weak global perturbations alter the spatiotemporal dynamics of large-scale cortical network dynamics remain a matter of debate. Here, we simulated large-scale networks of spiking neuron models to address this question in endogenously rhythmic networks. We identified distinct roles of the depolarizing and hyperpolarizing phases of tACS in entrainment, which entailed moving network activity toward and away from a strong nonlinearity provided by the local excitatory coupling of pyramidal cells. Together, these mechanisms gave rise to resonance dynamics characterized by an Arnold tongue centered on the resonance frequency of the network. We then performed multichannel extracellular recordings of multiunit firing activity during tACS in anesthetized ferrets (Mustela putoris furo), a model species with a gyrencephalic brain, to verify that weak global perturbations can selectively enhance oscillations at the applied stimulation frequency. Together, these results provide a detailed mechanistic understanding of tACS at the level of large-scale network dynamics and support the future design of activity-dependent feedback tACS paradigms that dynamically tailor stimulation frequency to the spectral peak of ongoing brain activity.


Figures

Figure 1.
Figure 1.
Global oscillatory activity in computational model of cortical network. A, Sample membrane voltage traces of individual PYs and INs. B, Activity map of the PY (top) and IN (bottom) layer of the network shows periods of activity (UP states) and quiescence (DOWN states; cool colors, hyperpolarization; warm colors, depolarization). Two-dimensional layers of neurons flattened to one-dimensional representation. C, Percentage of neurons firing in the PY (top) and IN (bottom) layer of the network (4 s duration). D, Phase-plane representation of PY and IN activity demonstrates that a structured, temporal relationship of the activity between the excitatory and inhibitory networks gave rise to a global oscillation pattern. E, Two-dimensional maps of PY activity during a network UP state (membrane voltage color coded as above). Network activity originated in hotspots and subsequently expanded through lateral excitatory PY–PY connections.
Figure 2.
Figure 2.
Comparison of direct (tDCS, left) and alternating (tACS, right) current stimulation. A, Overall network activity of PY and IN layers with applied stimulation waveforms (left: tDCS; right: tACS). An fs = 3 Hz was chosen to approximately match the intrinsic network oscillation frequency. Stimulation (9 pA, modeling TCS) was applied to both networks. B, Spectrograms of the two simulations demonstrate the dramatic power increase at the simulated frequency during stimulation for the sinusoidal stimulation (right; average relative power at 3 Hz was 0.99 at stimulation onset) compared with the direct current stimulation (left; average relative power at 3 Hz was 0.29 at stimulation onset).
Figure 3.
Figure 3.
Time to phase lock after the onset of tACS. A, Change in power of networks stimulated at 3 Hz with 9 pA starting at different onset phases. The line color indicates the onset phase of the stimulation waveform at stimulation onset for that trial (increasing onset phase with warmer colors). All onset phases eventually entrained the network. B, Entrainment time (defined as 90% of peak steady-state power at the stimulation frequency) as a function of the onset phase of stimulation. The entrainment time was minimal for the network stimulated with the onset phase of stimulation at π. Insets 1 and 2 show the PY network activity for networks stimulated with the onset phase of stimulation set to 2.83 and 3.14 radians, respectively.
Figure 4.
Figure 4.
The number of activity sites in the network increased as the network became more synchronized. A, Sites of activity (hotspots) were identified by counting groups of neurons with high firing rates. B, Top two plots, Network activity of the PY layer of a network stimulated using 9 pA tDCS and the number of activity sites. Bottom two plots, Hotspot activity for a network stimulated using tACS at 3 Hz and 9 pA. Unstimulated and tDC-stimulated conditions resulted in uniform hotspot activity, but tACS caused formation of bimodal peaks in the time course of hotspots. C, Plots of the relationship between network activity and the number of hotspots for unstimulated (left), tDCS (middle), and tACS (right) networks. The network was only fully activated with tACS; the maximum number of hotspots was seen just before or after an UP state.
Figure 5.
Figure 5.
Applying hyperpolarizing-only stimulation was more effective than depolarizing-only stimulation at entraining the network. A, Network activity for the PY layers of networks stimulated using depolarizing-only (left) and hyperpolarizing-only (right) stimulation waveforms. Both networks were entrained to the stimulation frequency, but the network stimulated with the hyperpolarizing-only waveform exhibited more regular activity. B, Two-dimensional maps of the PY layers of the two networks indicating membrane voltage (left), firing rate (middle), and synaptic depression (right) of each neuron. The network subjected to hyperpolarizing-only stimulation exhibited a high density of hotspots, which were able to coalesce more quickly than the depolarizing-only stimulated network.
Figure 6.
Figure 6.
Phase space plots of networks, which were unstimulated (left), received full-wave tACS (middle left), administered depolarizing-only stimulation (middle right), and hyperpolarizing-only stimulation (right). Networks receiving full-wave tACS and hyperpolarizing-only stimulation are nearly identical, demonstrating that these stimulation paradigms had equivalent effects on the network. A, Network activity of the PY layer as a function of the stimulation phase. PYs were active almost exclusively during phases 0 to π of the stimulation for hyperpolarizing-only stimulation and full-wave tACS networks and was at a maximum when the phase of stimulation was ∼0.5 π. PY activity of the depolarizing-only stimulated network was more widely distributed and less regular. B, Hotspot count as a function of the stimulation phase. C, Histogram of total number of onset sites. Onset sites were defined as hotspots occurring when network activity was increasing but <10% of maximum network activity.
Figure 7.
Figure 7.
Correlation of synaptic depression and network activity. A, The relationship between average synaptic depression of PYs to the network activity of PYs, for an unstimulated network, a network stimulated using full-wave tACS, depolarizing-only stimulated network, and hyperpolarizing-only stimulated network (top to bottom). Networks with more regular cortical dynamics (full-wave tACS and hyperpolarizing-only stimulation) experienced tighter coupling between the two parameters. B, Local maxima of average synaptic depression throughout simulation. Stimulation onset occurred at time 0. As the network became more regular, synaptic depression was able to reset more fully before it was depressed by the next UP state.
Figure 8.
Figure 8.
Comparison of SL and RG stimulation. A, Overall PY activity for a SL stimulated network with 50% of PYs stimulated. Stimulated neuron activity (dark blue) and unstimulated neuron activity (light blue) are shown. Inset, A 2-D map of PYs with stimulated neurons shown in black. B, 2-D maps of PYs of SL stimulated network with 50% of PYs stimulated indicating firing rate of individual neurons from PYs of network from A at different times through an UP state. The stimulated (top) and unstimulated (bottom) halves of the network are separated by a red line. C, Total activity for RG stimulated network with 50% of PYs stimulated. D, 2-D maps of the PY subnetwork of the RG-stimulated network indicating the firing rate of each neuron with each frame taken at a different time during the initiation of an UP state. E, The relative power of the network activity versus the percentage of PYs stimulated for networks receiving SL (left) and RG (right) stimulation.
Figure 9.
Figure 9.
Series of simulations with tACS applied as a function of stimulation amplitude (1–13 pA) and frequency (0–6 Hz). A, Network activity of the PY layer for each simulation. Warmer colors indicate the higher power of network activity at the stimulated frequency. A prominent Arnold's tongue was present, in which entrainment of the network at its intrinsic resonant frequencies (3 and 6 Hz) required the lowest amplitude of stimulation. The range of frequencies the network was able to entrain increased with increasing stimulation amplitude. B, Frequency of maximum power for the stimulated networks. Same structure as in A. C, Average number of hotspots for the stimulated networks.
Figure 10.
Figure 10.
The presence of network bistability with alternating periods of entrainment and lack of entrainment for stimulation frequencies that do not match intrinsic (harmonic) frequencies. The same matrix representation as in Figure 9, with spectrograms shown for each stimulation condition. Fragmentation of power away from intrinsic frequencies resulted in macroscopic, bistable dynamics with periods of entrainment interleaved with periods of seemingly little stimulation effect.
Figure 11.
Figure 11.
tACS in anesthetized ferrets enhanced cortical oscillations at the stimulation frequency.A, Top, Schematic representation of experimental setup; bottom, sample multiunit activity and stimulation trace. B, Averaged spectrogram for all stimulation frequencies. C, Depth profiles of spectrograms. D, Time-averaged change in spectra (gray: 95% confidence interval). E, Power of network activity at stimulation frequency during versus before tACS. Stimulation frequencies are color coded. F, Phase histograms show the preferred phase of network activity for superficial cortical layers (entropy is color coded, with hotter colors indicating lower entropy.).

Comment in

References

    1. Allegrini P, Menicucci D, Bedini R, Fronzoni L, Gemignani A, Grigolini P, West BJ, Paradisi P. Spontaneous brain activity as a source of ideal 1/f noise. Phys Rev E Stat Nonlin Soft Matter Phys. 2009;80 doi: 10.1103/PhysRevE.80.061914. 061914. - DOI - PubMed
    1. Antal A, Boros K, Poreisz C, Chaieb L, Terney D, Paulus W. Comparatively weak after-effects of transcranial alternating current stimulation (tACS) on cortical excitability in humans. Brain Stimul. 2008;1:97–105. doi: 10.1016/j.brs.2007.10.001. - DOI - PubMed
    1. Bazhenov M, Rulkov NF, Timofeev I. Effect of synaptic connectivity on long-range synchronization of fast cortical oscillations. J Neurophysiol. 2008;100:1562–1575. doi: 10.1152/jn.90613.2008. - DOI - PMC - PubMed
    1. Berényi A, Belluscio M, Mao D, Buzsáki G. Closed-loop control of epilepsy by transcranial electrical stimulation. Science. 2012;337:735–737. doi: 10.1126/science.1223154. - DOI - PMC - PubMed
    1. Brignani D, Ruzzoli M, Mauri P, Miniussi C. Is transcranial alternating current stimulation effective in modulating brain oscillations? PLoS One. 2013;8:e56589. doi: 10.1371/journal.pone.0056589. - DOI - PMC - PubMed

Publication types