. 2013 Jun 25;8(6):e64817.
doi: 10.1371/journal.pone.0064817. Print 2013.

Odin (ANKS1A) modulates EGF receptor recycling and stability

Affiliations

Odin (ANKS1A) modulates EGF receptor recycling and stability

Jiefei Tong et al. PLoS One. .

Abstract

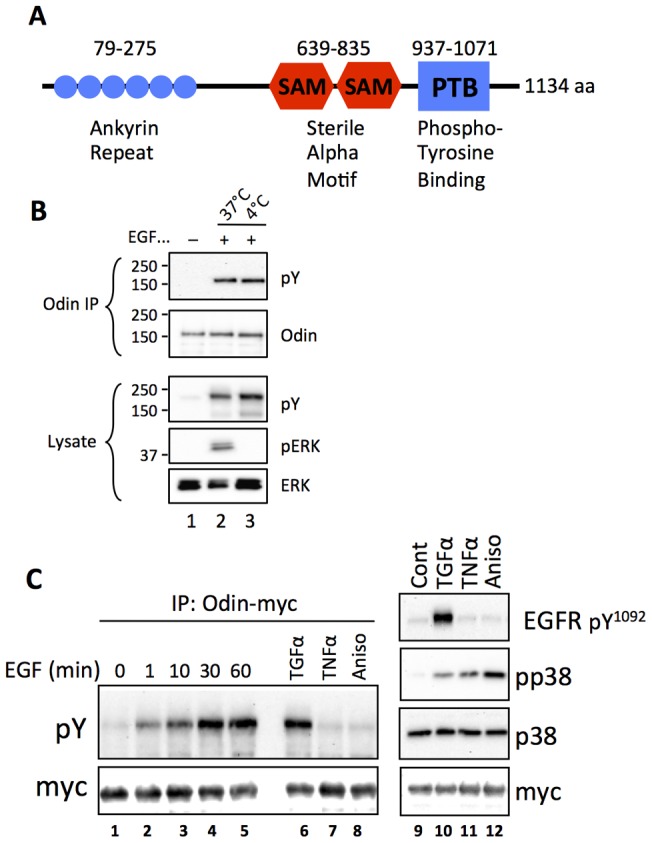
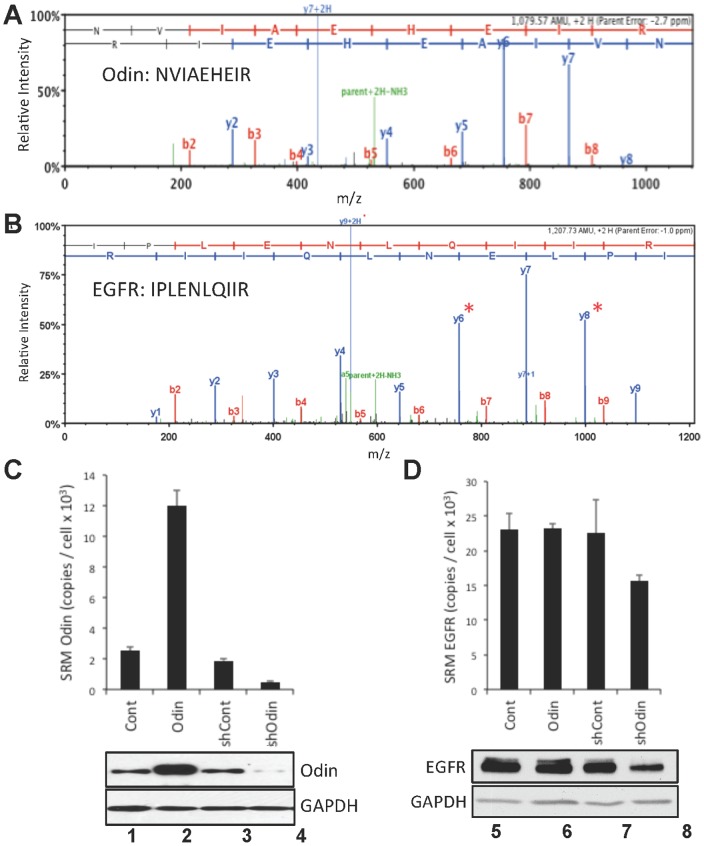
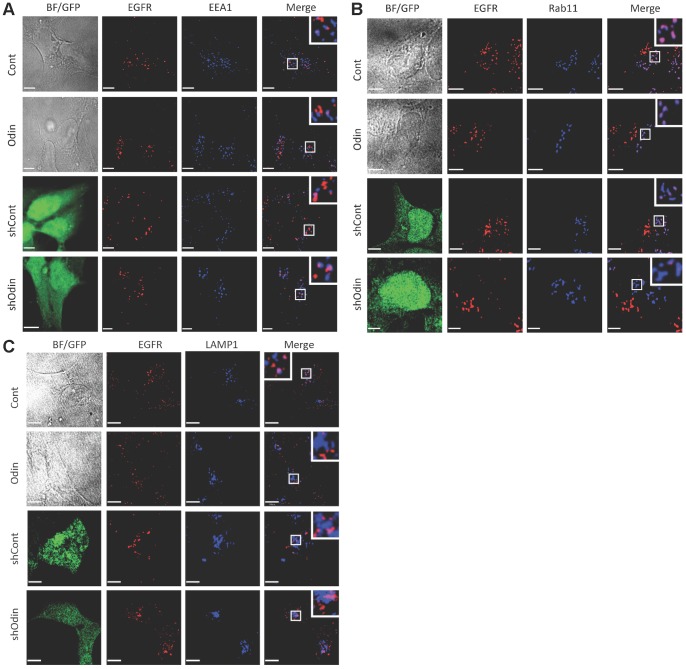
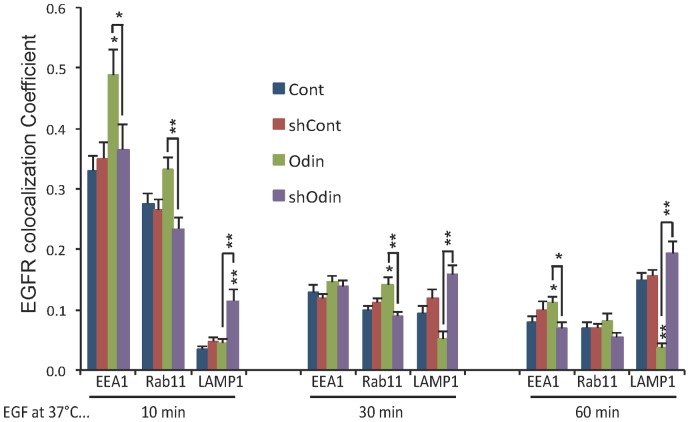
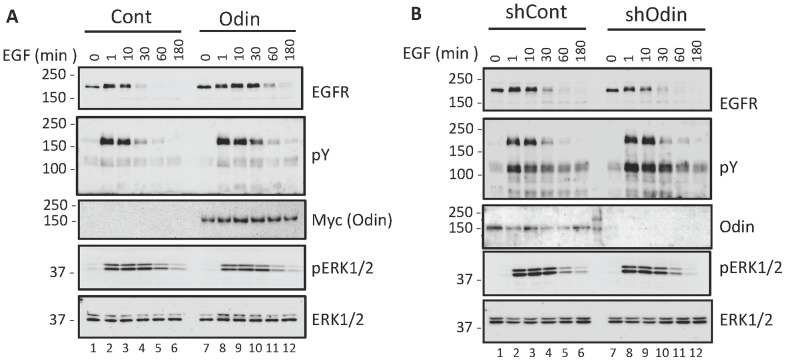
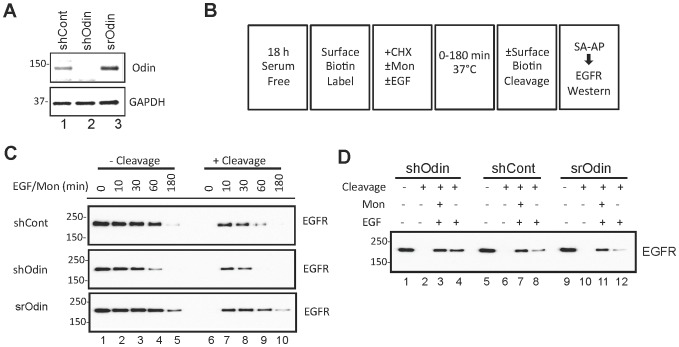
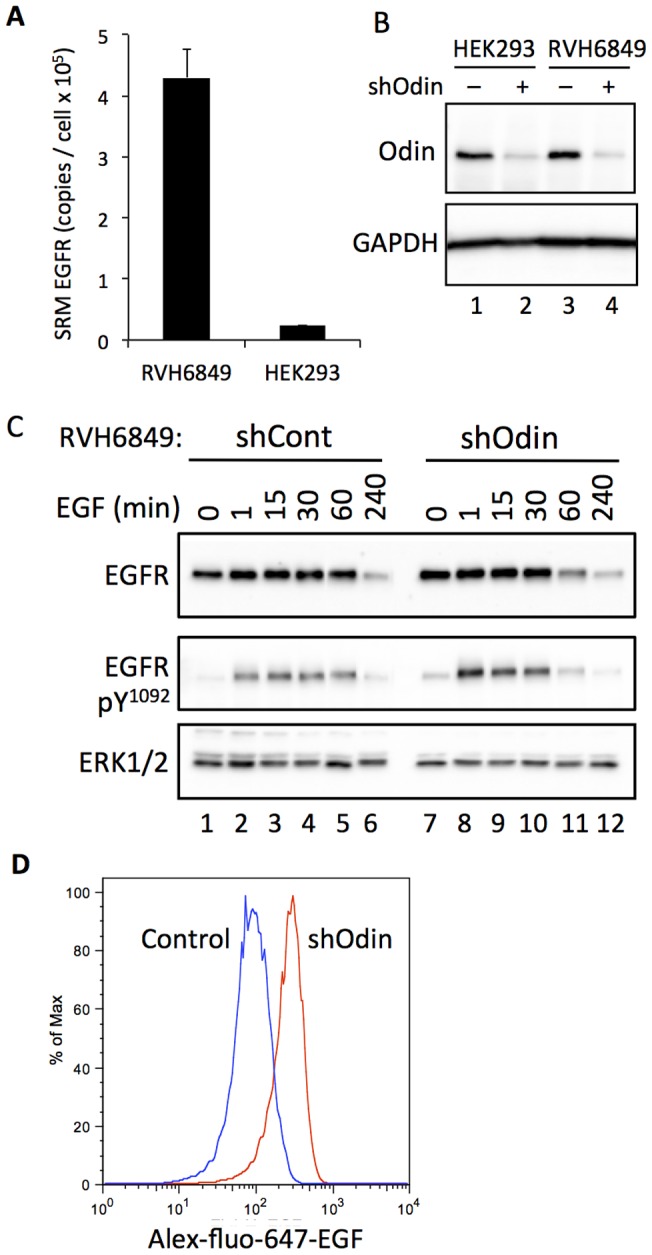
The ANKS1A gene product, also known as Odin, was first identified as a tyrosine-phosphorylated component of the epidermal growth factor receptor network. Here we show that Odin functions as an effector of EGFR recycling. In EGF-stimulated HEK293 cells tyrosine phosphorylation of Odin was induced prior to EGFR internalization and independent of EGFR-to-ERK signaling. Over-expression of Odin increased EGF-induced EGFR trafficking to recycling endosomes and recycling back to the cell surface, and decreased trafficking to lysosomes and degradation. Conversely, Odin knockdown in both HEK293 and the non-small cell lung carcinoma line RVH6849, which expresses roughly 10-fold more EGF receptors than HEK293, caused decreased EGFR recycling and accelerated trafficking to the lysosome and degradation. By governing the endocytic fate of internalized receptors, Odin may provide a layer of regulation that enables cells to contend with receptor cell densities and ligand concentration gradients that are physiologically and pathologically highly variable.


Conflict of interest statement

Competing Interests: The authors have declared that no competing interests exist.

Figures

Figure 1
Figure 1. Phosphorylation of the adaptor-like protein Odin in ligand-stimulated and stress-activated cells.
A, Schematic drawing of the domain structure of Odin (not to scale) showing amino acid numbers of the indicated features; adapted from Pandey et al. (36). HEK293 cells that stably express EGFR-Flag were subjected to anti-Odin IP of endogenous Odin (B) after treatment with EGF at 37°C or 4°C. The IPs and whole cell lysates were analyzed by Western blot for phosphotyrosine (pY), Odin, and phosphorylated (pERK) or total ERK1/2 proteins (ERK). C, Western blot analysis of anti-myc IPs from the same cells after transient transfection with an Odin-myc expression vector, and treatment with EGF (100 ng/ml) for the indicated durations, and with TGFα (50 ng/ml), TNFα (100 ng/ml), and anisomycin (Aniso; 10 µM) for 15 min. Results shown are representative of three independent experiments.
Figure 2
Figure 2. Quantification of Odin and EGFR by SRM.
Representative MS/MS spectra of tryptic peptides of (A) Odin sequence NVIAEHEIR (residues 325–333), and (B) EGFR sequence IPLENLQIIR, showing resolved b (red) and y (blue) fragment ions. Odin (C) and EGFR (D) expression level (mean ±SEM, n = 4) in HEK293 cells (Cont), HEK293 stably expressing ectopic Odin (Odin), HEK293 following infection with lentivirus encoding a non-silencing control shRNA (shCont) or lentivirus encoding an Odin-directed shRNA (shOdin) were measured by SRM-MS. The indicated peptides from Odin and EGFR were measured by using the transitions indicated in Table 1 and converted to copies-per-cell by using standard curves developed from measurements of known dilutions of recombinant Odin (see SI Fig. 1), or relative to a spiked-in, stable isotope-containing standard peptide of identical sequence for EGFR. The aligned western blots (15 µg total protein per lane) were probed for Odin or EGFR as indicated, and GAPDH as a loading control. EGFR quantification was performed with enriched membrane preparations (see Materials and Methods).
Figure 3
Figure 3. The effect of Odin expression on EGFR trafficking.
A–C, EGFR endocytosis after 30 min EGF treatment. Serum-deprived Cont, Odin, ShCont and ShOdin cells were incubated on ice with EGF (50 ng/ml) for 30 min, washed free of unbound ligand, and then provided pre-warmed ligand-free medium at 37°C for 30 min. The first column shows bright field or direct green fluorescence (which identifies lentivirus-infected cells). The cells were fixed and stained with EGFR antibodies (red, second column) and antibodies to EEAI (panel A), Rab11 (panel B), or LAMP1 (panel C) (blue, third column), wherein pink indicates co-localization (Merge, fourth column). Insets show an additional 3-fold magnification of the boxed area. Scale bars are 5 µm.
Figure 4
Figure 4. The effect of Odin expression on EGFR trafficking.
EGFR co-localization with EEA1, Rab11, and LAMP1, after the indicated incubation time with EGF was quantified by using Volocity software (Perkin Elmer). Co-localization coefficients (mean ±SEM, n = 10) represent pixel overlap between EGFR and EEA1, Rab11, or LAMP1. The coefficient ranges from 0 to 1, with 0 corresponding to non-overlapping images and 1 corresponding to 100% overlap. Asterisks above bars indicate a statistically significant difference from control (Odin v. Cont; shOdin v. shCont); and asterisks above connecting lines indicates the significance of the difference between the connected bars: * p<0.05; ** p<0.01.
Figure 5
Figure 5. Effect of Odin expression on EGF induced EGFR degradation.
A–B, Whole cell lysates from HEK293 cells (Cont), or this cell type stably expressing ectopic Odin (Odin), a control non-silencing shRNA (shCont), or an Odin-directed shRNA (shOdin) were prepared after treatment with EGF (10 ng/ml, 37°C) for the indicated durations, and then western blotted with the indicated antibodies. The results shown are representative of three experiments.
Figure 6
Figure 6. Effect of Odin on EGFR recycling.
A, Western blot analysis of the whole cell lysates from lentivirus infected cells expressing a non-silencing control (shCont) or Odin-directed (shOdin) shRNA, or shOdin cells with stable ectopic expression of myc-Odin encoded by an shRNA-resistant Odin expression vector (srOdin). B, A schematic drawing showing from left to right the sequential experimental steps employed to measure EGFR degradation and internalization in shOdin, shCont and srOdin cells (monensin, mon; CHX, cyclohexamide, streptavidin affinity purification, SA-AP). C, Time-course of EGF stimulation of cells with basal (shCont), knocked down (shOdin) or rescued/over-expressed levels of Odin expression. Biotinylated EGFR was captured by using streptavidin (SA) beads, and then western blotted for EGFR. When cell surface biotin was removed prior to the SA adsorption step (+ cleavage), only internalized (i.e. protected from cleavage) EGFR are expected to be recovered, whereas in the absence of cleavage (- cleavage) both internalized and plasma membrane-localized EGFR would be captured. The cells were treated with monensin (Mon) to block receptor recycling. D, The effect of monensin on the amount of intracellular EGFR. Western blot analysis of biotin-labeled EGFR (captured by immobilized streptavidin) with indicated cleavage, EGF, and monensin treatment for 10 min. Results shown are representative of three independent experiments.
Figure 7
Figure 7. Effect of reduced Odin expression on EGFR cell surface localization and EGF-induced EGFR downregulation in non-small cell lung carcinoma (NSCLC) cells.
A, The concentrations of endogenous wild type EGFR protein in HEK293 and RVH6849 were determined by using SRM-MS and a spiked-in heavy isotope labelled EGFR peptide (Table 1). B, Western blot analysis confirmed the efficient lentivirus/shRNA-mediated knock down of endogenous Odin protein expression in the two cell types, and compared with GAPDH as a loading control. C, RVH6849-shCont and RVH6849-shOdin were treated with EGF (10 ng/ml, 37°C) for the indicated durations, and then immuno-blotted with the indicated antibodies. The result shown is representative of three experiments. D, RVH6849 with (shOdin, red) or without (Control, blue) knock down of endogenous Odin were incubated with Alex-Fluo-647-conjugated EGF and then quantified by FACS according to the bound ligand as a measure of cell surface EGFR. SRM measurements (A) represent mean ±SE for 4 independent passages of the indicated cells.

Similar articles

Cited by

References

    1. Schlessinger J (2002) Ligand-induced, receptor-mediated dimerization and activation of EGF receptor. Cell 110: 669–672. - PubMed
    1. Yarden Y (2001) The EGFR family and its ligands in human cancer. signalling mechanisms and therapeutic opportunities. Eur J Cancer 37 Suppl 4S3–8. - PubMed
    1. Sorkin A, Goh LK (2008) Endocytosis and intracellular trafficking of ErbBs. Exp Cell Res 314: 3093–3106. - PMC - PubMed
    1. Grandal MV, Madshus IH (2008) Epidermal Growth Factor Receptor and Cancer: Control of Oncogenic Signalling by Endocytosis. J Cell Mol Med 12: 1527–1534. - PMC - PubMed
    1. Sebastian S, Settleman J, Reshkin SJ, Azzariti A, Bellizzi A, et al. (2006) The complexity of targeting EGFR signalling in cancer: from expression to turnover. Biochim Biophys Acta 1766: 120–139. - PubMed

Publication types