

Revealing less derived nature of cartilaginous fish genomes with their evolutionary time scale inferred with nuclear genes
- PMID: 23825540
- PMCID: PMC3692497
- DOI: 10.1371/journal.pone.0066400
Revealing less derived nature of cartilaginous fish genomes with their evolutionary time scale inferred with nuclear genes
Abstract
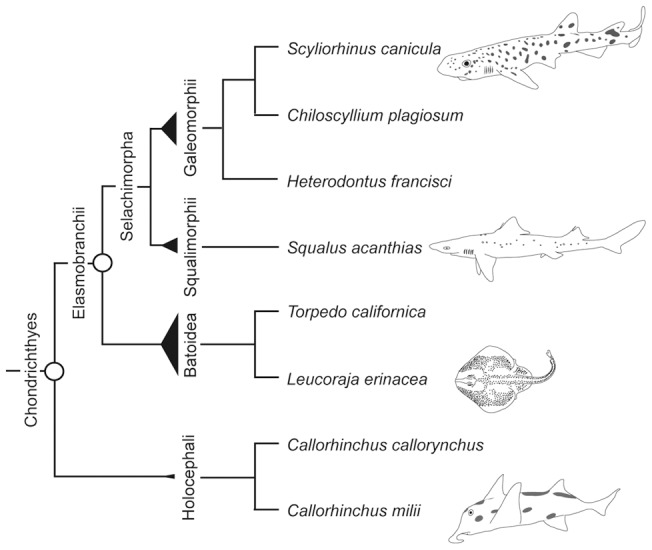
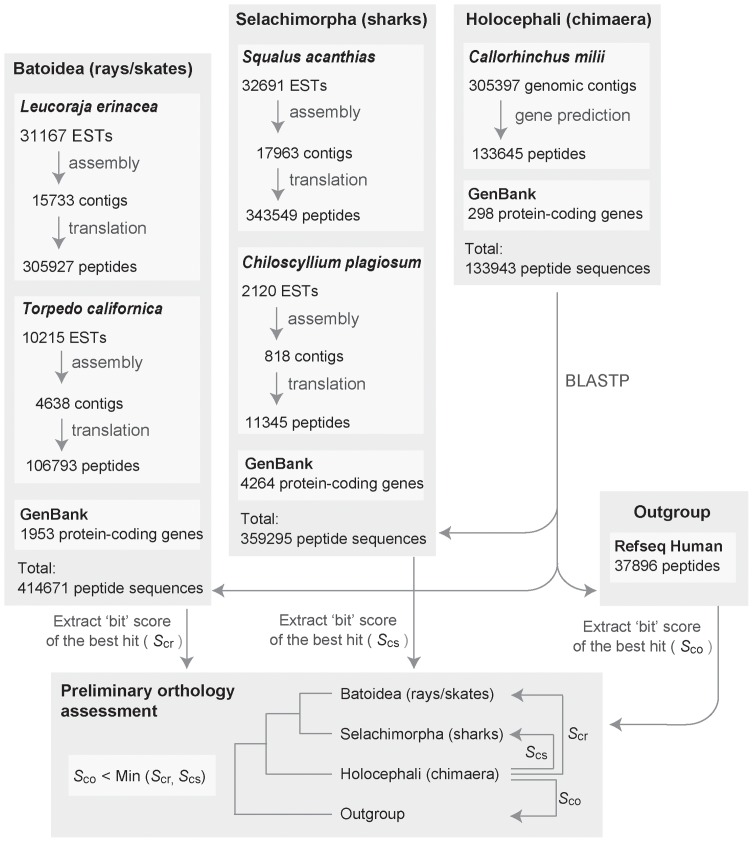
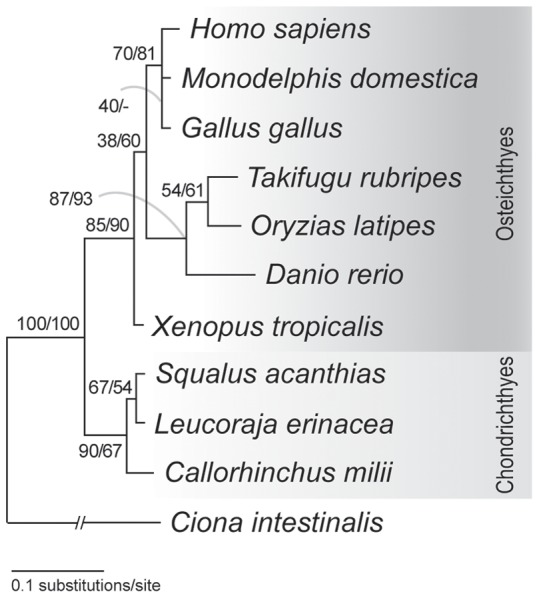
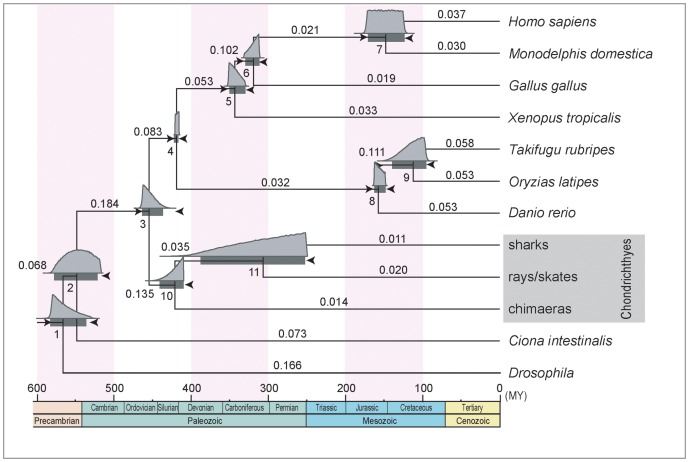
Cartilaginous fishes, divided into Holocephali (chimaeras) and Elasmoblanchii (sharks, rays and skates), occupy a key phylogenetic position among extant vertebrates in reconstructing their evolutionary processes. Their accurate evolutionary time scale is indispensable for better understanding of the relationship between phenotypic and molecular evolution of cartilaginous fishes. However, our current knowledge on the time scale of cartilaginous fish evolution largely relies on estimates using mitochondrial DNA sequences. In this study, making the best use of the still partial, but large-scale sequencing data of cartilaginous fish species, we estimate the divergence times between the major cartilaginous fish lineages employing nuclear genes. By rigorous orthology assessment based on available genomic and transcriptomic sequence resources for cartilaginous fishes, we selected 20 protein-coding genes in the nuclear genome, spanning 2973 amino acid residues. Our analysis based on the Bayesian inference resulted in the mean divergence time of 421 Ma, the late Silurian, for the Holocephali-Elasmobranchii split, and 306 Ma, the late Carboniferous, for the split between sharks and rays/skates. By applying these results and other documented divergence times, we measured the relative evolutionary rate of the Hox A cluster sequences in the cartilaginous fish lineages, which resulted in a lower substitution rate with a factor of at least 2.4 in comparison to tetrapod lineages. The obtained time scale enables mapping phenotypic and molecular changes in a quantitative framework. It is of great interest to corroborate the less derived nature of cartilaginous fish at the molecular level as a genome-wide phenomenon.
Conflict of interest statement
Figures
References
-
- Janvier P (1996) Early vertebrates. Oxford: Oxford University Press.
-
- Nelson JM (1994) Fishes of the world. New York: Wiley.
-
- Maisey JG (1984) Higher Elasmobranch Phylogeny and Biostratigraphy. Zool J Linn Soc-Lond 82: 33–54.
-
- Coates MI, Sequeira SEK (2001) Early sharks and primitive gnathostome interrelationships. In: Ahlberg PE, editor. Major Events in Early Vertebrate Evolution Palaeontology, phylogeny, genetics and development. London: Taylor & Francis. 241–262.
Publication types
MeSH terms
Substances
Associated data
- Actions
- Actions
- Actions
- Actions
- Actions
- Actions
- Actions
LinkOut - more resources
Full Text Sources
Other Literature Sources
