. 2013 Jun 25;8(6):e67894.
doi: 10.1371/journal.pone.0067894. Print 2013.

Alternative complement pathway deficiency ameliorates chronic smoke-induced functional and morphological ocular injury

Affiliations

Alternative complement pathway deficiency ameliorates chronic smoke-induced functional and morphological ocular injury

Alex Woodell et al. PLoS One. .

Abstract

Background: Age-related macular degeneration (AMD), a complex disease involving genetic variants and environmental insults, is among the leading causes of blindness in Western populations. Genetic and histologic evidence implicate the complement system in AMD pathogenesis; and smoking is the major environmental risk factor associated with increased disease risk. Although previous studies have demonstrated that cigarette smoke exposure (CE) causes retinal pigment epithelium (RPE) defects in mice, and smoking leads to complement activation in patients, it is unknown whether complement activation is causative in the development of CE pathology; and if so, which complement pathway is required.

Methods: Mice were exposed to cigarette smoke or clean, filtered air for 6 months. The effects of CE were analyzed in wildtype (WT) mice or mice without a functional complement alternative pathway (AP; CFB(-/-) ) using molecular, histological, electrophysiological, and behavioral outcomes.

Results: CE in WT mice exhibited a significant reduction in function of both rods and cones as determined by electroretinography and contrast sensitivity measurements, concomitant with a thinning of the nuclear layers as measured by SD-OCT imaging and histology. Gene expression analyses suggested that alterations in both photoreceptors and RPE/choroid might contribute to the observed loss of function, and visualization of complement C3d deposition implies the RPE/Bruch's membrane (BrM) complex as the target of AP activity. RPE/BrM alterations include an increase in mitochondrial size concomitant with an apical shift in mitochondrial distribution within the RPE and a thickening of BrM. CFB(-/-) mice were protected from developing these CE-mediated alterations.

Conclusions: Taken together, these findings provide clear evidence that ocular pathology generated in CE mice is dependent on complement activation and requires the AP. Identifying animal models with RPE/BrM damage and verifying which aspects of pathology are dependent upon complement activation is essential for developing novel complement-based treatment approaches for the treatment of AMD.


Conflict of interest statement

Competing Interests: The authors have declared that no competing interests exist.

Figures

Figure 1
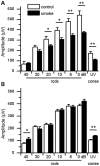
Figure 1. Electroretinography analysis for WT and CFB −/− mice following CE.
ERG recordings were performed in cohorts of age-matched WT (A) and CFB −/− (B) mice exposed to 6 months of cigarette smoke (CE) or room air. Dark-adapted, scotopic ERGs were recorded in response to increasing light intensities, and light-adapted photopic UV-cone ERGs to a single, maximum light intensity. Scotopic ERGs were analyzed using multiple ANOVA, followed by comparison of individual light intensities using t-test analyses. WT mice exposed to smoke had significantly lower dark-adapted b-wave amplitudes compared to controls (P<0.001), in particular at higher light intensities (20, 10, 6, 0 dB). Impairment in cone function is evidenced by the reduction in maximum UV-cone b-wave amplitudes. In comparison, ERG amplitudes in both scotopic and photopic ERGs were unaffected in AP-deficient mice exposed to smoke. Photoreceptor cell responses (a-waves), which drive the b-waves, were equally affected (data not shown). Data are expressed as mean ±SEM (n = 6–8 per condition; *, P<0.05; **, P<0.001).
Figure 2
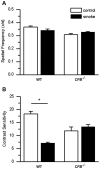
Figure 2. CE does not affect visual acuity, but impairs contrast sensitivity.
Optomotor responses were analyzed in WT and CFB −/− mice after exposure to 6 months of cigarette smoke (CE) or room air. (A) Visual acuity was measured by identifying the spatial frequency threshold at a constant speed (12 deg/sec) and contrast (100%). Spatial frequency thresholds were not affected by treatment, although a genotype-dependent difference in visual acuity was identified (WT versus CFB −/− at room air, P<0.001). (B) Contrast sensitivity was measured by taking the reciprocal of the contrast threshold at a fixed spatial frequency (0.131 cyc/deg) and speed (12 deg/sec). We previously determined that this spatial frequency falls within the range of maximal contrast sensitivity for 9-month-old WT mice (data not shown). WT mice after CE showed a significant reduction in contrast sensitivity compared to controls, while AP-deficient mice remained unchanged. As for visual acuity, contrast sensitivity was affected by genotype (P<0.001), with CFB −/− mice being significantly less sensitive. Data are expressed as mean ±SEM (n = 3–9 per condition; *, P<0.01).
Figure 3
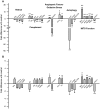
Figure 3. Gene expression changes in ocular tissues between WT and CFB −/− mice following CE.
Analysis of marker gene expression in WT (A) and CFB −/− (B) mice, using quantitative RT-PCR on cDNA generated from RPE/choroid/sclera fraction and retina. Quantitative values were obtained by cycle number (Ct value), determining the difference between the mean experimental and control (Actb) ΔCt values for cigarette smoke (CE) versus room-air-exposed mice within each genotype (fold difference). Candidates were examined from a number of categories including photoreceptor cell function (Rho, Opn1sw, Opn1mw, Rpe65), complement activation (C3, Cfb, Cfd, Cfh, Cd55, Cd59a), control of angiogenesis (Vegfa, Serpinf1), oxidative stress (Hif1a, Cp), autophagy (Lyz1, Lamp2, Klc3), and mitochondrial function (Mfn1, mt-Co1, Dnm1l, Ndufb8, Pfkfb1, Hmox1). Significant changes were identified in all six categories for WT mice, suggesting decreased cone function and chromosphere production, increased complement activation, the generation of a pro-angiogenic, and oxidative environment with impaired repair processes (autophagy) and reduced energy production under CE conditions. In comparison, gene expression was minimally affected in CFB −/− animals. Data are expressed as mean ±SEM (n = 3 per condition; *, P<0.05).
Figure 4
Figure 4. Gene expression changes in WT liver following CE.
Analysis of complement gene expression in WT mice, using quantitative RT-PCR on cDNA generated from liver. Quantitative values were obtained by cycle number (Ct value), determining the difference between the mean experimental and control (Actb) ΔCt values for cigarette smoke (CE) versus room-air-exposed WT mice (fold difference). Complement components C3 and C5 (hemolytic complement, Hc) were significantly elevated along with AP activators Cfb and Cfp, whereas C9 remained unchanged. Data are expressed as mean ±SEM (n = 3 per condition; *, P<0.001).
Figure 5
Figure 5. Optical coherence tomography and histological sections from WT and CFB −/− mice following CE.
Posterior poles from WT (AD) and AP-deficient (EH) mice were analyzed in vivo using OCT (A,B and E,F) and ex vivo using histology (C,D and G,H), comparing cigarette smoke (CE) and control conditions. OCT measurements were taken ∼0.5 mm from the optic nerve head in the nasal quadrant. There is visible thinning of the ONL (red) and INL (blue) in WT animals that is absent in CFB −/− mice. Light microscopy performed on epoxy sections of central retina, derived from WT and CFB −/− animals, supports the thinning observed in OCT images for WT mice exposed to smoke.
Figure 6
Figure 6. C3d deposition in eyes exposed to smoke.
Localization of the complement activation product, C3d, one of the C3 opsonins that binds covalently to (cell) membranes was identified using immunohistochemistry, comparing WT (A,B) or CFB −/− mice (C,D) exposed to room air (A,C) or cigarette smoke (CE) (B,D). Intense C3d immunoreactivity (brown deposits) was seen in RPE/BrM and choroid in smoke-exposed WT mice when compared to controls. In mice lacking the AP tick-over mechanism and amplification loop, reduced staining was observed in RPE/BrM and choroid after CE, whereas those animals exposed to room air demonstrated no immunoreactivity. Please note that in order to perform labeling in the pigmented RPE and choroid, melanin was bleached, resulting in faint pigmentation and revealing the nuclei of the RPE.
Figure 7
Figure 7. Ultrastructural changes in WT and CFB −/− mice following CE.
Electron micrographs of the RPE/BrM/choriocapillaris complex (RPE/BrM/CC) obtained from WT and CFB −/− mice exposed to 6 months of cigarette smoke (CE) or room air were compared. (A) In a WT animal raised in room air, BrM exhibits an organized pentalaminar structure, consisting of RPE-BM, RPE basement membrane; ICL, inner collagenous layer; MEL, middle elastic layer; OCL, outer collagenous layer; CC-BM, choriocapillaris basement membrane; and the choriocapillaris endothelium has fenestrations along the entire membrane. (B) The RPE/BrM/CC in a WT animal exposed to smoke exhibits pathological changes. BrM is disorganized, losing its pentalaminar structure, and large deposits are present within the OCL. Note the presence of choriocapillaris fenestrations (arrowheads) overlying BrM of normal thickness, but fenestration loss and/or endothelial cell thickening adjacent to OCL deposits (asterisks). (C) The RPE/BrM/CC is not affected by the elimination of CFB, but is preserved in CFB −/− mice exposed to smoke inhalation (D). Insets highlight the morphological features of mitochondria with degraded outer membranes and disorganized cristae in WT mice exposed to smoke and normal appearance in the other three samples.
Figure 8
Figure 8. Mitochondrial localization is altered after CE.
Mitochondrial position was determined from electron micrographs (depicted in Figure 7) by determining their centroid coordinates as a percentage of the corresponding RPE length and thickness, respectively. Each centroid was subsequently assigned to one of 4 bins (basolateral, basal, central, or apical). (A) The normalized positions of mitochondria within RPE of WT animals exposed to room air demonstrates that mitochondria are anchored predominantly along the basolateral and basal walls of the RPE cells and are more sparse throughout the central and apical portion (see text for more detail). (B) Cigarette smoke exposure (CE) affects the mitochondrial distribution in WT animals, with mitochondria exhibiting an apical shift from the basal to central compartment. (C) Mitochondrial distribution is not affected by genotype, with CFB −/− mice raised under control conditions exhibiting a normal distribution profile. (D) Six months of CE had no effect on mitochondrial distribution in CFB −/− animals.

References

    1. Ferris FL 3rd, Wilkinson CP, Bird A, Chakravarthy U, Chew E, et al. (2013) Clinical classification of age-related macular degeneration. Ophthalmology 120: 844–851. - PMC - PubMed
    1. Freund KB, Zweifel SA, Engelbert M (2010) Do we need a new classification for choroidal neovascularization in age-related macular degeneration? Retina 30: 1333–1349. - PubMed
    1. Brown MM, Brown GC, Stein JD, Roth Z, Campanella J, et al. (2005) Age-related macular degeneration: economic burden and value-based medicine analysis. Can J Ophthalmol 40: 277–287. - PubMed
    1. Edwards AO, Ritter R, 3rd, Abel KJ, Manning A, Panhuysen C, et al (2005) Complement factor H polymorphism and age-related macular degeneration. Science 308: 421–424. - PubMed
    1. Hageman GS, Anderson DH, Johnson LV, Hancox LS, Taiber AJ, et al. (2005) A common haplotype in the complement regulatory gene factor H (HF1/CFH) predisposes individuals to age-related macular degeneration. Proc Natl Acad Sci U S A 102: 7227–7232. - PMC - PubMed

Publication types

MeSH terms