

Bayesian hierarchical distributed lag models for summer ozone exposure and cardio-respiratory mortality
- PMID: 23825932
- PMCID: PMC3697867
- DOI: 10.1002/env.721
Bayesian hierarchical distributed lag models for summer ozone exposure and cardio-respiratory mortality
Abstract
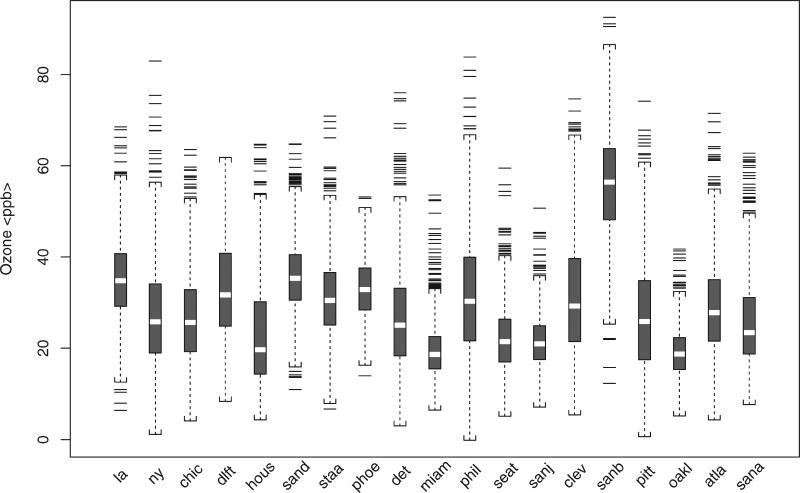
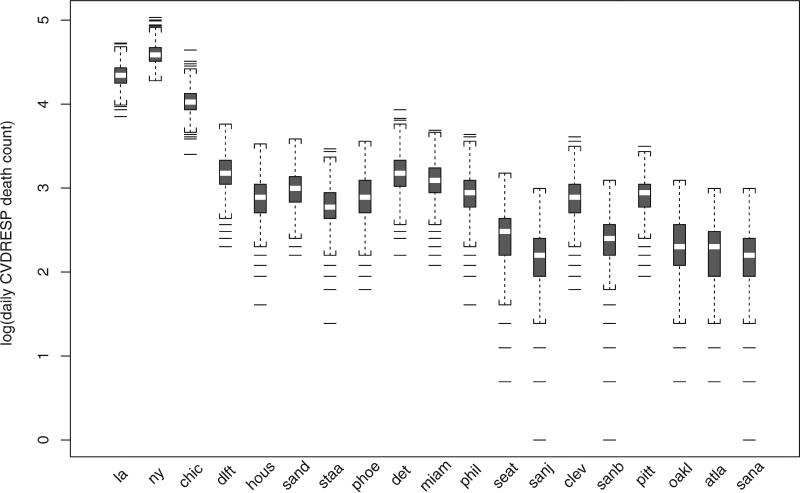
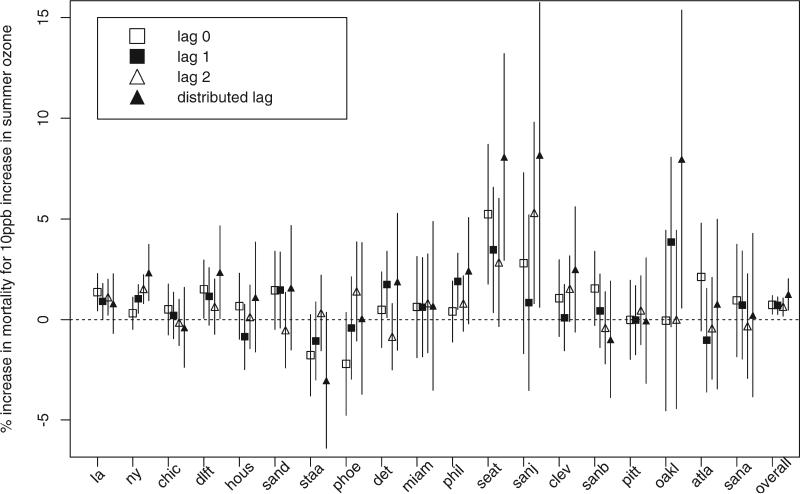
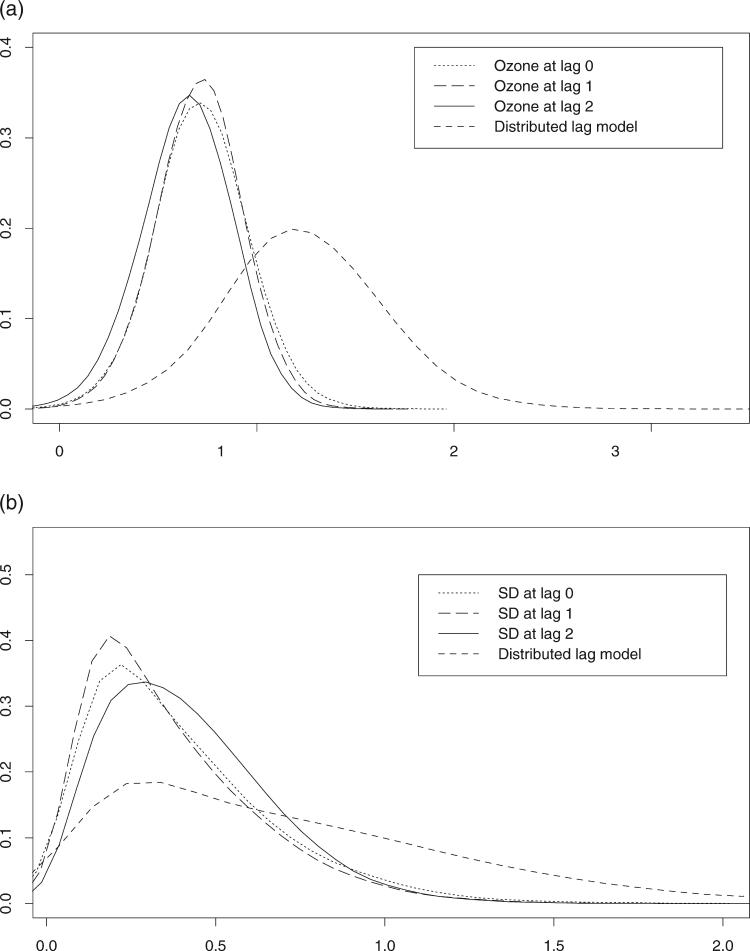
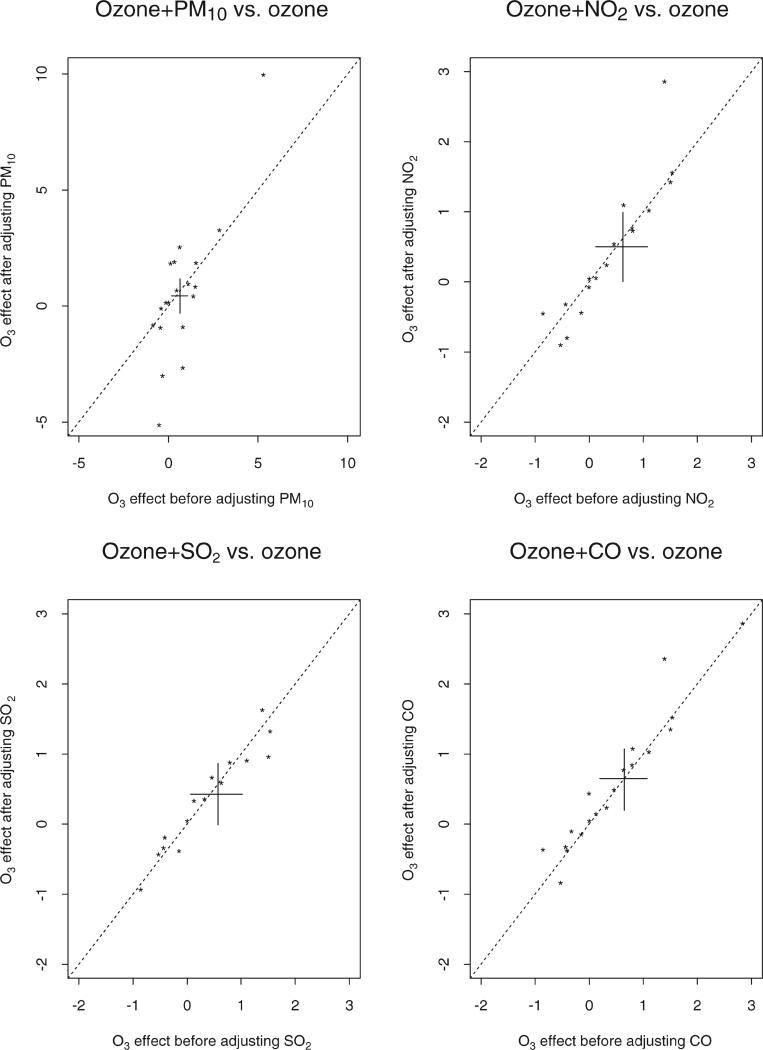
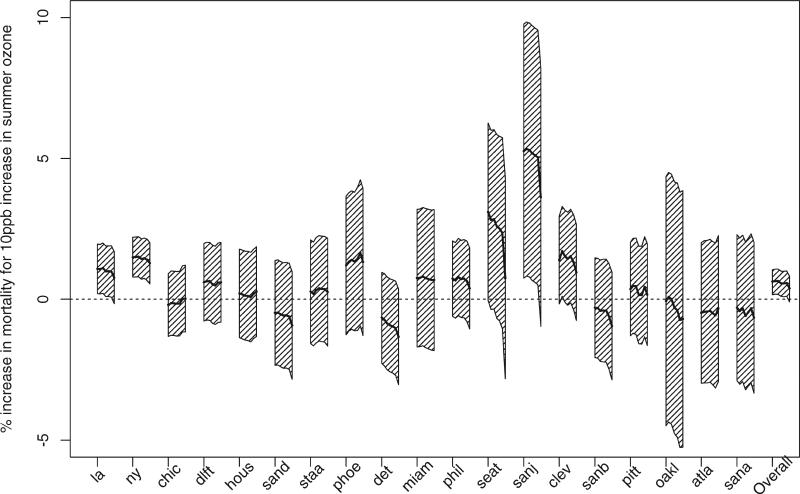
In this article we develop Bayesian hierarchical distributed lag models for estimating associations between daily variations in summer ozone levels and daily variations in cardiovascular and respiratory (CVDRESP) mortality counts for 19 large U.S. cities included in the National Morbidity, Mortality and Air Pollution Study (NMMAPS) for the summers of 1987-1994. In the first stage, we define a semi-parametric distributed lag Poisson regression model to estimate city-specific relative rates of CVDRESP mortality associated with short-term exposure to summer ozone. In the second stage, we specify a class of distributions for the true city-specific relative rates to estimate an overall effect by taking into account the variability within and across cities. We perform the calculations with respect to several random effects distributions (normal, t-student, and mixture of normal), thus relaxing the common assumption of a two-stage normal-normal hierarchical model. We assess the sensitivity of the results to: (i) lag structure for ozone exposure; (ii) degree of adjustment for long-term trends; (iii) inclusion of other pollutants in the model; (iv) heat waves; (v) random effects distributions; and (vi) prior hyperparameters. On average across cities, we found that a 10ppb increase in summer ozone level over the previous week is associated with a 1.25 per cent increase in CVDRESP mortality (95 per cent posterior regions: 0.47, 2.03). The relative rate estimates are also positive and statistically significant at lags 0, 1 and 2. We found that associations between summer ozone and CVDRESP mortality are sensitive to the confounding adjustment for PM10, but are robust to: (i) the adjustment for long-term trends, other gaseous pollutants (NO2, SO2 and CO); (ii) the distributional assumptions at the second stage of the hierarchical model; and (iii) the prior distributions on all unknown parameters. Bayesian hierarchical distributed lag models and their application to the NMMAPS data allow us to estimate of an acute health effect associated with exposure to ambient air pollution in the last few days on average across several locations. The application of these methods and the systematic assessment of the sensitivity of findings to model assumptions provide important epidemiological evidence for future air quality regulations.
Keywords: Bayesian hierarchical model; cardiovascular and respiratory mortality; distributed lag model; ozone.
Figures
References
-
- Almon S. The distributed lag between capital appropriations and expenditures. Econometrica. 1965;33(1):178–196.
-
- Andreae M, Crutzen P. Atmospheric aerosols: biogeochemical sources and role in atmopheric chemistry. Science. 1997;276:1052–1058.
-
- Burnett R, Dales R, Raizenne M, Krewski D, Summers P, Roberts G, Raad-Young M, Dann T, Brook J. Effects of low ambient levels of ozone and sulfates on frequency of respiratory admisions to Ontario hospitals. Environmental Reseach. 1994;65:172–194. - PubMed
-
- Burnett R, Brook J, Yung W, Dales R, Krewski D. Association between ozone and hospitalization for respiratory diseases in 16 Canadian cities. Environmental Research. 1997a;72:24–31. - PubMed
Grants and funding
LinkOut - more resources
Full Text Sources