

Prospective in (Primate) dental analysis through tooth 3D topographical quantification
- PMID: 23826088
- PMCID: PMC3691165
- DOI: 10.1371/journal.pone.0066142
Prospective in (Primate) dental analysis through tooth 3D topographical quantification
Abstract
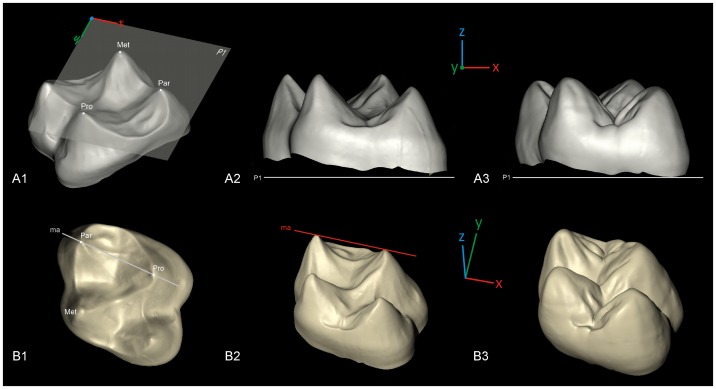
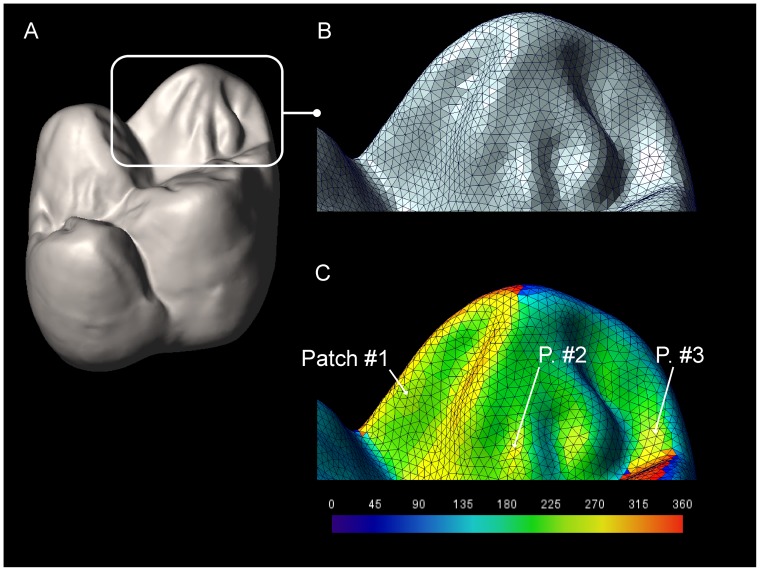
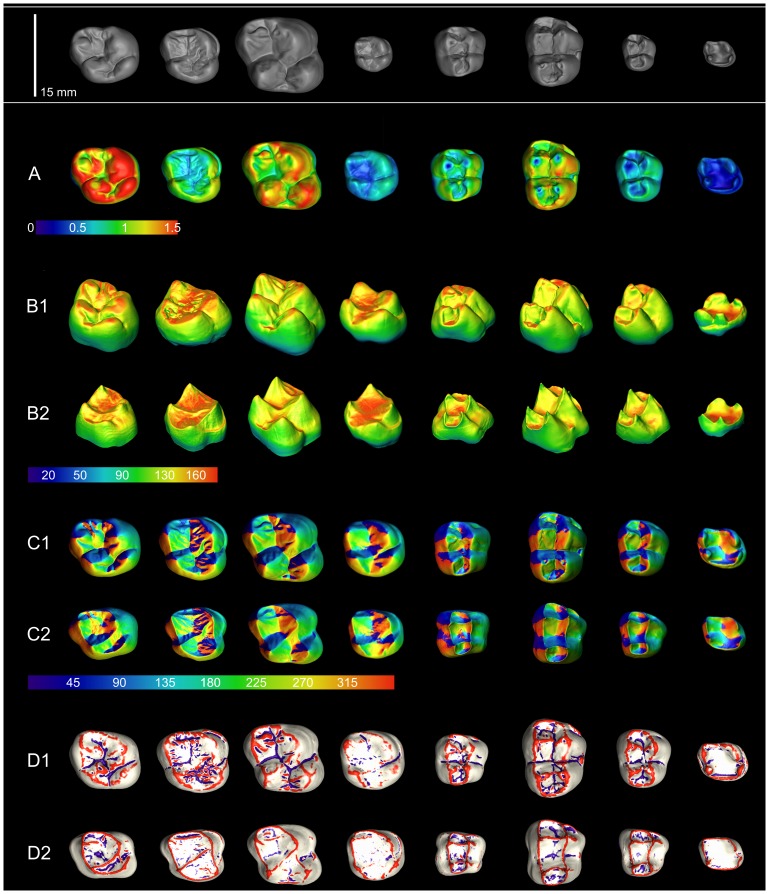
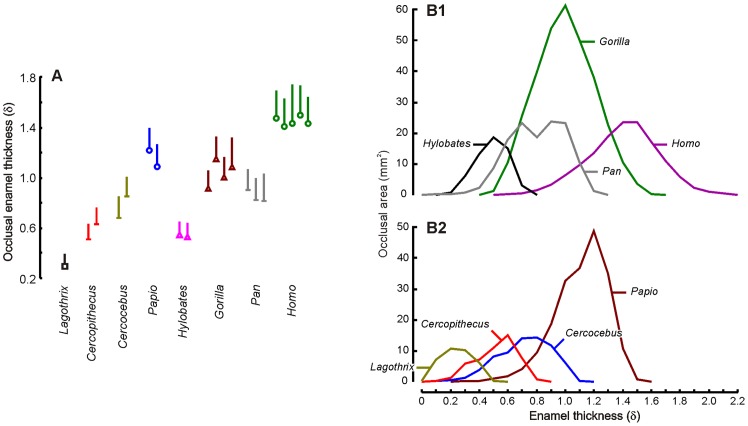
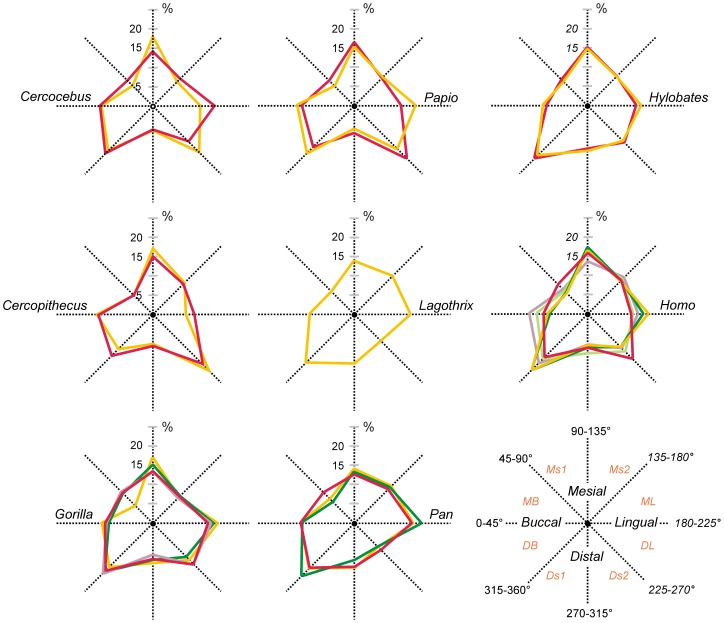
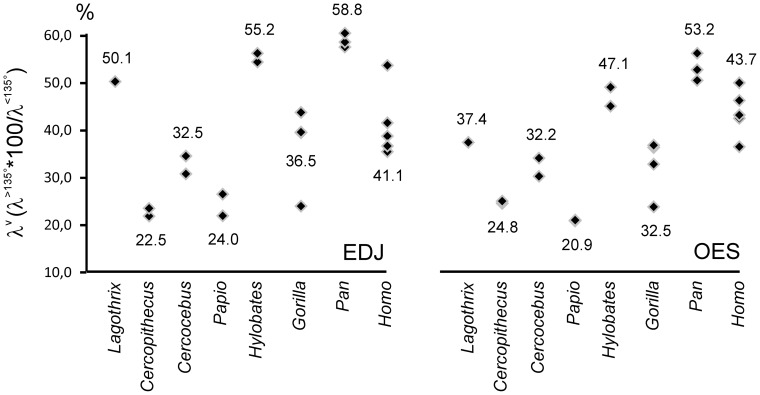
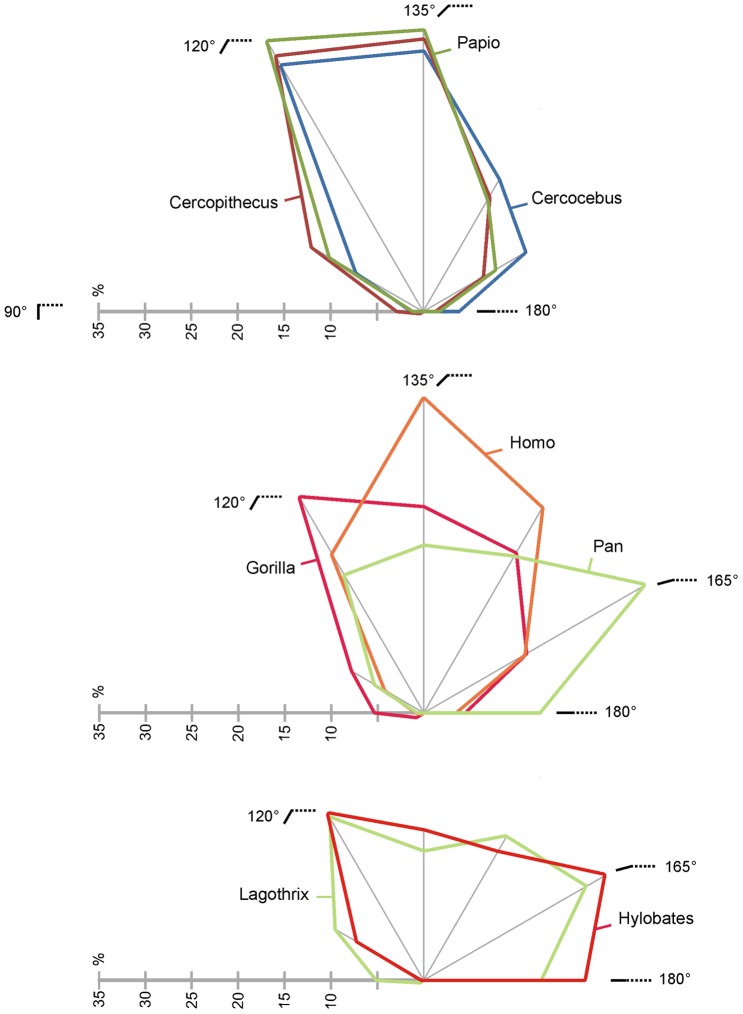
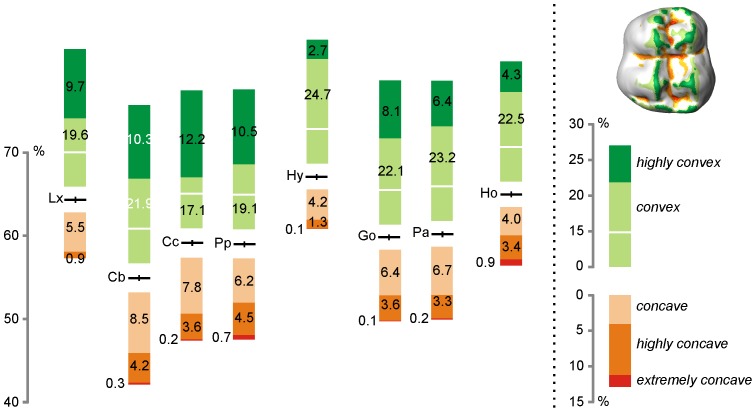
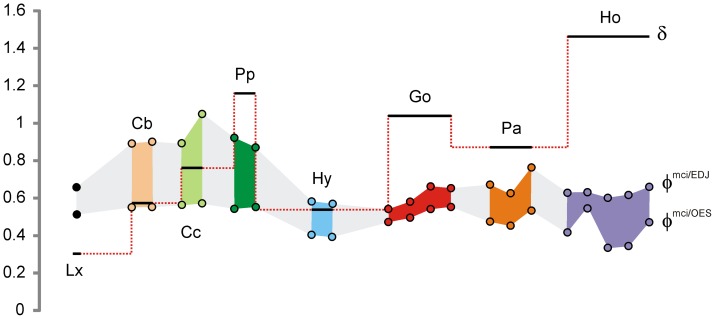
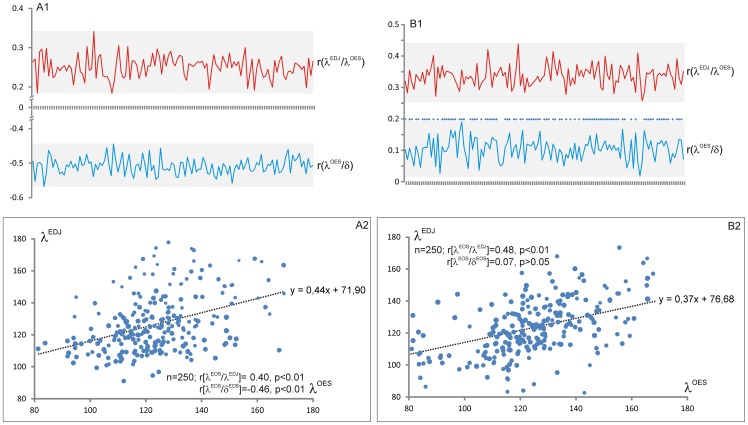
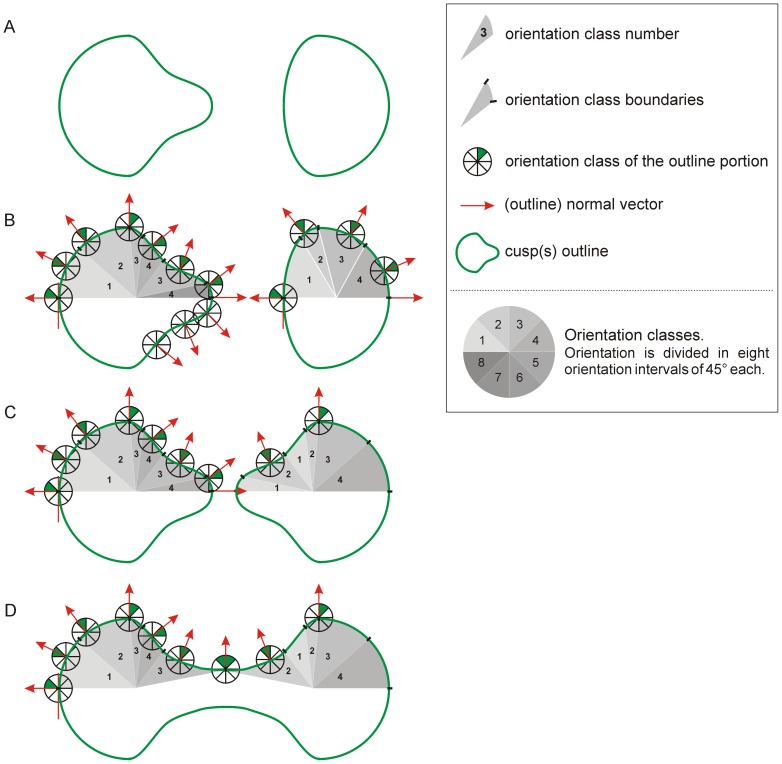
The occlusal morphology of the teeth is mostly determined by the enamel-dentine junction morphology; the enamel-dentine junction plays the role of a primer and conditions the formation of the occlusal enamel reliefs. However, the accretion of the enamel cap yields thickness variations that alter the morphology and the topography of the enamel-dentine junction (i.e., the differential deposition of enamel by the ameloblasts create an external surface that does not necessarily perfectly parallel the enamel-dentine junction). This self-reliant influence of the enamel on tooth morphology is poorly understood and still under-investigated. Studies considering the relationship between enamel and dentine morphologies are rare, and none of them tackled this relationship in a quantitative way. Major limitations arose from: (1) the difficulties to characterize the tooth morphology in its comprehensive tridimensional aspect and (2) practical issues in relating enamel and enamel-dentine junction quantitative traits. We present new aspects of form representation based exclusively on 3D analytical tools and procedures. Our method is applied to a set of 21 unworn upper second molars belonging to eight extant anthropoid genera. Using geometrical analysis of polygonal meshes representatives of the tooth form, we propose a 3D dataset that constitutes a detailed characterization of the enamel and of the enamel-dentine junction morphologies. Also, for the first time, to our knowledge, we intend to establish a quantitative method for comparing enamel and enamel-dentine junction surfaces descriptors (elevation, inclination, orientation, etc.). New indices that allow characterizing the occlusal morphology are proposed and discussed. In this note, we present technical aspects of our method with the example of anthropoid molars. First results show notable individual variations and taxonomic heterogeneities for the selected topographic parameters and for the pattern and strength of association between enamel-dentine junction and enamel, the enamel cap altering in different ways the "transcription" of the enamel-dentine junction morphology.
Conflict of interest statement
Figures
Similar articles
-
To What Extent is Primate Second Molar Enamel Occlusal Morphology Shaped by the Enamel-Dentine Junction?PLoS One. 2015 Sep 25;10(9):e0138802. doi: 10.1371/journal.pone.0138802. eCollection 2015. PLoS One. 2015. PMID: 26406597 Free PMC article.
-
Modeling enamel matrix secretion in mammalian teeth.PLoS Comput Biol. 2019 May 29;15(5):e1007058. doi: 10.1371/journal.pcbi.1007058. eCollection 2019 May. PLoS Comput Biol. 2019. PMID: 31141513 Free PMC article.
-
Quantification of dentine shape in anthropoid primates.Ann Anat. 2004 Dec;186(5-6):479-85. doi: 10.1016/S0940-9602(04)80087-6. Ann Anat. 2004. PMID: 15646281
-
Modern human molar enamel thickness and enamel-dentine junction shape.Arch Oral Biol. 2006 Nov;51(11):974-95. doi: 10.1016/j.archoralbio.2006.04.012. Epub 2006 Jun 30. Arch Oral Biol. 2006. PMID: 16814245 Review.
-
Utilization of periodic markings in enamel to obtain information on tooth growth.J Hum Evol. 1998 Oct-Nov;35(4-5):387-400. doi: 10.1006/jhev.1998.0260. J Hum Evol. 1998. PMID: 9774501 Review.
Cited by
-
Ambient occlusion and PCV (portion de ciel visible): A new dental topographic metric and proxy of morphological wear resistance.PLoS One. 2019 May 1;14(5):e0215436. doi: 10.1371/journal.pone.0215436. eCollection 2019. PLoS One. 2019. PMID: 31042728 Free PMC article.
-
Dental topographic proxies for ecological characteristics in carnivoran mammals.J Anat. 2023 Apr;242(4):627-641. doi: 10.1111/joa.13806. Epub 2023 Jan 23. J Anat. 2023. PMID: 36690466 Free PMC article.
-
To What Extent is Primate Second Molar Enamel Occlusal Morphology Shaped by the Enamel-Dentine Junction?PLoS One. 2015 Sep 25;10(9):e0138802. doi: 10.1371/journal.pone.0138802. eCollection 2015. PLoS One. 2015. PMID: 26406597 Free PMC article.
-
Molar biomechanical function in South African hominins Australopithecus africanus and Paranthropus robustus.Interface Focus. 2021 Aug 13;11(5):20200085. doi: 10.1098/rsfs.2020.0085. eCollection 2021 Oct 6. Interface Focus. 2021. PMID: 34938434 Free PMC article.
-
Early evolution of the ossicular chain in Cetacea: into the middle ear gears of a semi-aquatic protocetid whale.Proc Biol Sci. 2019 Oct 9;286(1912):20191417. doi: 10.1098/rspb.2019.1417. Epub 2019 Oct 2. Proc Biol Sci. 2019. PMID: 31575370 Free PMC article.
References
-
- Gilbert CC, Frost SR, Strait DS (2009) Allometry, sexual dimorphism, and phylogeny: A cladistic analysis of extant African papionins using craniodental data. J Hum Evol 57: 298–320. - PubMed
-
- Grine FE, Ungar PS, Teaford MF, El-Zaatari S (2006) Molar microwear in Praeanthropus afarensis: evidence for dietary stasis through time and under diverse paleoecological conditions. J Hum Evol 51: 297–319. - PubMed
-
- Hlusko LJ, Lease LR, Mahaney MC (2006) Evolution of genetically correlated traits: Tooth size and body size in baboons. Am J Phys Anthrop 131: 420–427. - PubMed
-
- Jernvall J, Jung HS (2000) Genotype, phenotype, and developmental biology of molar. tooth characters. Ybk Phys Anthrop 43: 171–190. - PubMed
Publication types
MeSH terms
LinkOut - more resources
Full Text Sources
Other Literature Sources
Miscellaneous
