. 2013 Jun 24;8(6):e66541.
doi: 10.1371/journal.pone.0066541. Print 2013.

HSPB1 facilitates the formation of non-centrosomal microtubules

Affiliations

HSPB1 facilitates the formation of non-centrosomal microtubules

Leonardo Almeida-Souza et al. PLoS One. .

Abstract

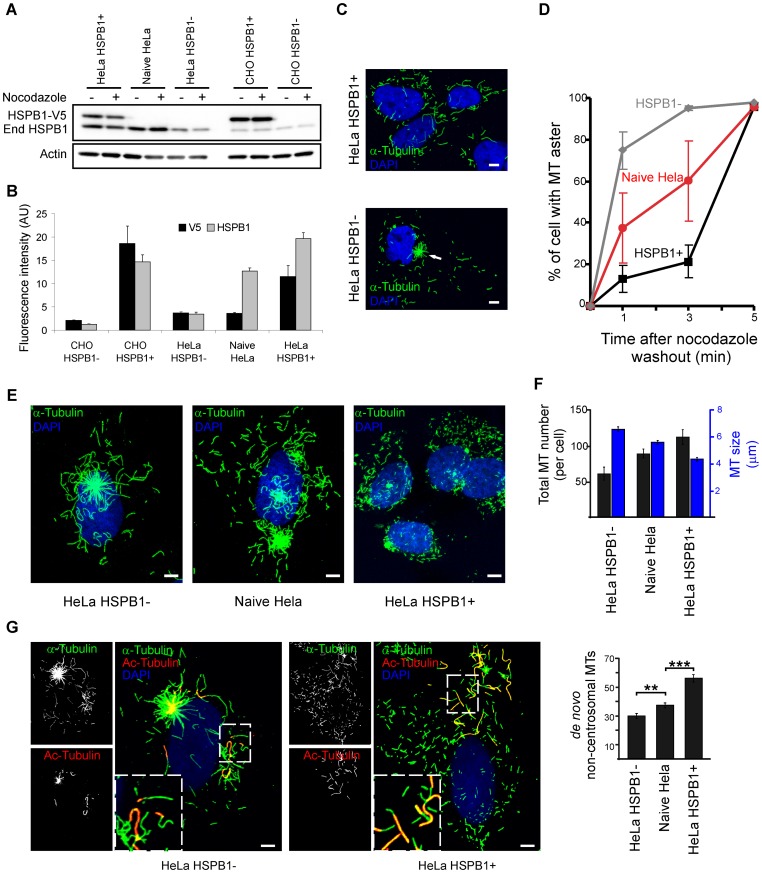
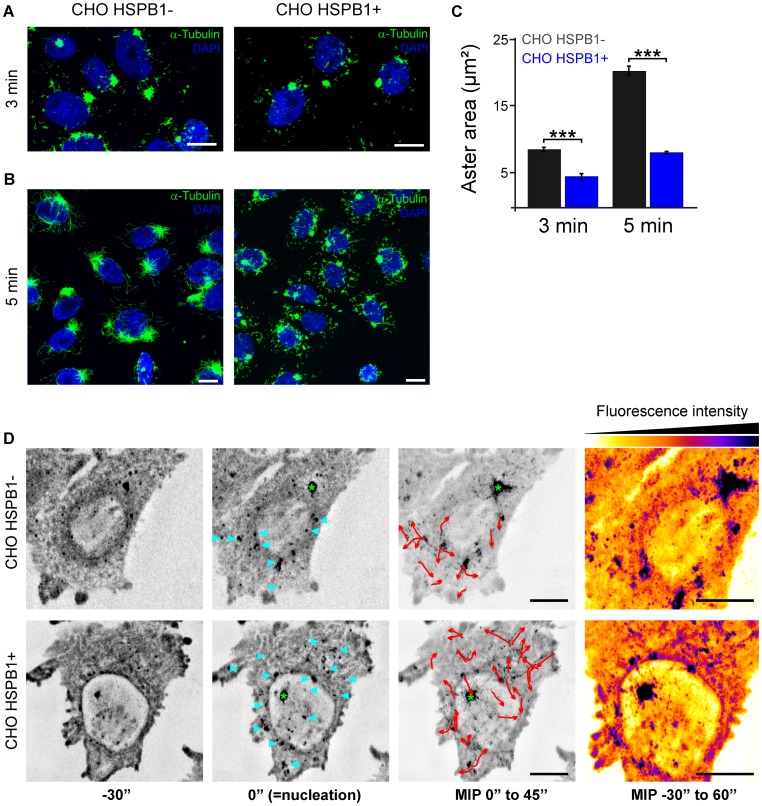
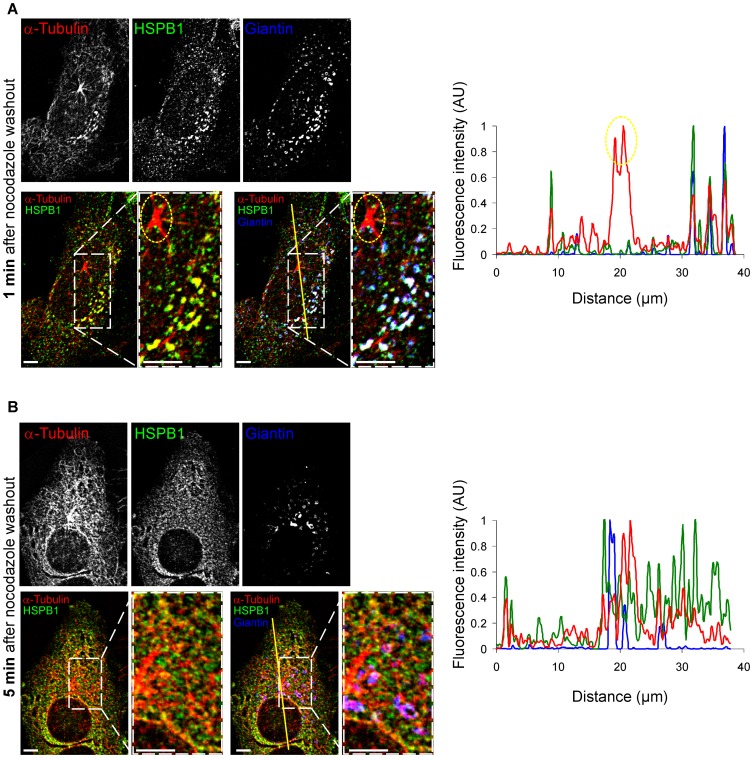
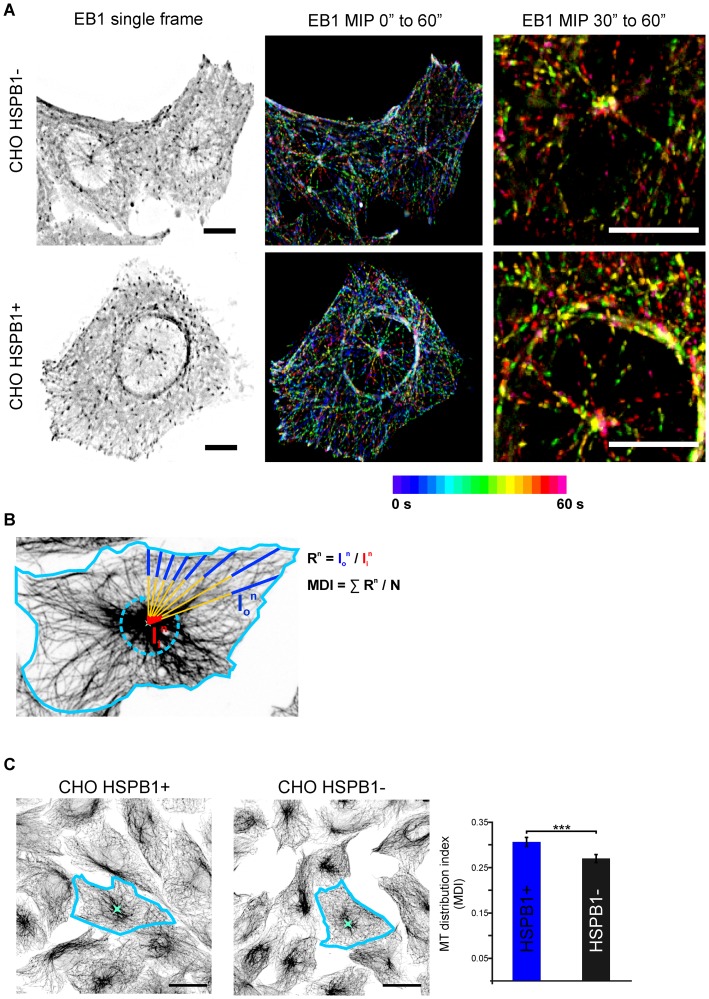
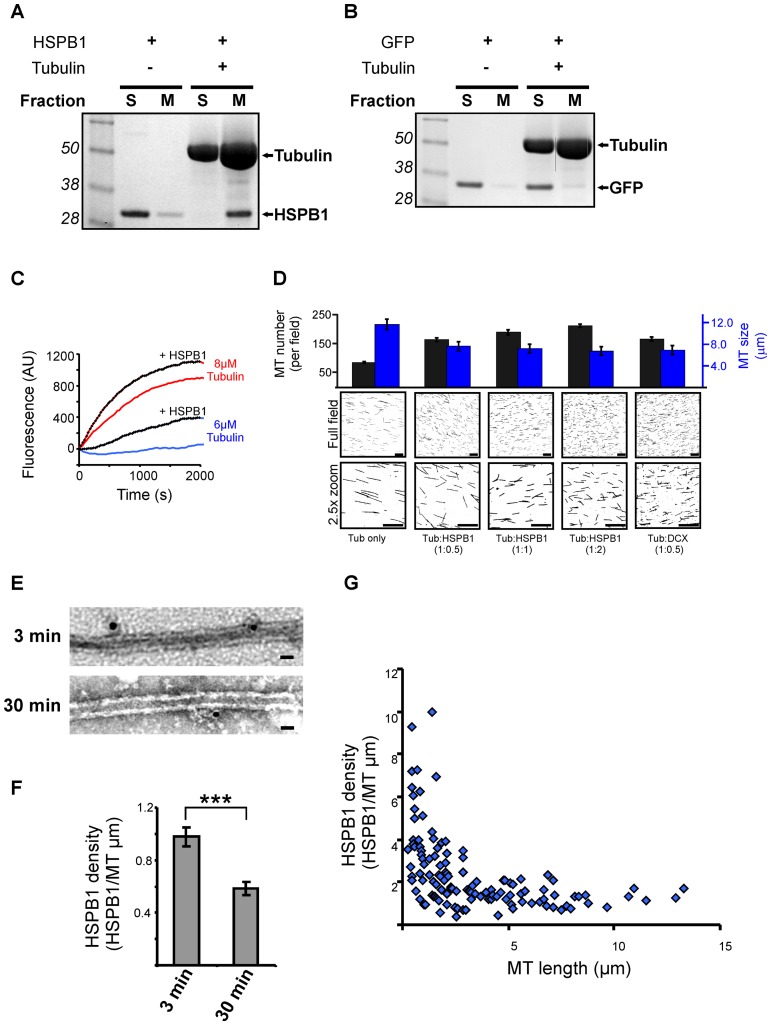
The remodeling capacity of microtubules (MT) is essential for their proper function. In mammals, MTs are predominantly formed at the centrosome, but can also originate from non-centrosomal sites, a process that is still poorly understood. We here show that the small heat shock protein HSPB1 plays a role in the control of non-centrosomal MT formation. The HSPB1 expression level regulates the balance between centrosomal and non-centrosomal MTs. The HSPB1 protein can be detected specifically at sites of de novo forming non-centrosomal MTs, while it is absent from the centrosomes. In addition, we show that HSPB1 binds preferentially to the lattice of newly formed MTs in vitro, suggesting that its function occurs by stabilizing MT seeds. Our findings open new avenues for the understanding of the role of HSPB1 in the development, maintenance and protection of cells with specialized non-centrosomal MT arrays.


Conflict of interest statement

Competing Interests: The authors have declared that no competing interests exist.

Figures

Figure 1
Figure 1. HSPB1 facilitates the formation of non-centrosomal microtubules in HeLa cells.
(A) Western blot using a polyclonal anti-HSPB1 antibody showing different HSPB1 expression levels in HeLa and CHO cells before and after nocodazole treatment. These were obtained by using either non-transduced cells (called naive Hela and CHO HSPB1-), cells transduced with HSPB1-V5 (called HeLa HSPB1+ and CHO HSPB1+) or cells transduced with shRNA HSPB1 constructs (called HeLa HSPB1-). End HSPB1 = endogenous HSPB1. (B) Fluorescence quantification of HSPB1 expression using anti-V5 and anti-HSPB1 antibodies in different HeLa and CHO stable cell lines (V5/HSPB1 staining n = 33/56, 63/58, 36/48, 50/41, 32/53 for CHO HSPB1-, CHO HSPB1+, HeLa HSPB1−, Naive HeLa and HeLa HSPB1+, respectively). (C) Representative images from HeLa HSPB1+ and HeLa HSPB1- cells at 1 min after nocodazole washout. The white arrow indicates a MT aster that is present predominantly in HeLa HSPB1- cells. (D) Quantification of the percentage of cells containing a MT aster at different time points after nocodazole treatment (data from 3 independent experiments of at least 100 cells). (E) The MT distribution at 5 min after nocodazole washout showing a different repolymerization pattern between cells with different HSPB1 levels. (F) Quantification of the length and amount of total MTs cells expressing different amounts of HSPB1 at 5 min after nocodazole treatment (n = 24, 20, 20 cells for HSPB1+, Naive Hela and HSPB1-, respectively). (G) Representative images of HeLa HSPB1- and HeLa HSPB1+ stained for α- and acetyl-tubulin. For the quantifications shown in the graph, only MTs not showing acetylated regions were counted (n = 49, 64, 58 cells for HSPB1+, Naive Hela and HSPB1− respectively). In F and G, all averages are different from each other with p>0.05, with the exception of total MT number between HeLa HSPB1+ and Naive HeLa (p = 0.09). Data is presented as average ± SEM. Scale bars = 5 µm.
Figure 2
Figure 2. HSPB1 facilitates the formation of non-centrosomal microtubules in CHO cells.
Representative images from CHO HSPB1- and CHO HSPB1+ cells at (A) 3 min and (B) 5 min after nocodazole washout. Scale bar = 10 µm. For more examples, see Figure S3. (C) Quantification of the aster area of CHO HSPB1+ and CHO HSPB1- cells at 3 and 5 min after nocodazole washout (n = 90/83 and 106/106 for CHO HSPB1−/CHO HSPB1+ at 3 and 5 min respectively). Data is presented as average ± SEM. (D) Time lapse microscopy of EB1-GFP during nocodazole washout and MT polymerization in CHO HSPB1− and CHO HSPB1+ cells (see Movie S1). Image stacks comprising the complete cell volume were continuously acquired every 5 sec before, during and after nocodazole removal by medium exchange. Maximum intensity projections of all stacks were made and selected time points are shown with inverted grey scale. The appearance of the first EB1 fluorescence burst was set as time zero, which occurred within 1 min after the initiation of the washout procedure (middle images). Before the start of nucleation (left image), only static, residual EB1-GFP spots are visible. The images at the third column are maximum intensity projections (MIP) over time of 9 time points (45 sec) after nucleation. Nucleation sites are marked by blue arrowheads. 3D image deconvolution was applied on the image stacks. Red arrows show the EB1-GFP non-centrosomal comets tracked from nucleation sites. Green asterisk marks the centrosome. On the right side, MIP of the whole time sequence color-coded for intensity. Scale bar = 5 µm.
Figure 3
Figure 3. HSPB1 colocalizes to non-centrosomal formation sites only at early stages of repolymerization.
Naive HeLa cells stained for HSPB1, α-tubulin and the Golgi apparatus marker Giantin at (A) 1 min and (B) 5 min after nocodazole washout. Graphs represent line intensity plots for the lines drawn in the corresponding images. Note that HSPB1 does not colocalize with the centrosome (circled in yellow). 3D image deconvolution was applied on the image stacks in (A–B). Scale bar = 5 µm.
Figure 4
Figure 4. HSPB1 changes the architecture of the MT network in steady state cells.
(A) Live cell imaging of CHO cells expressing EB1-GFP (Movie S2). Maximum intensity projections color-coded for time of 20 (center) and 10 (right) frames. (For more examples, see Fig. S7 and Movie S3). Scale bar = 10 µm. (B) Graphical representation of the microtubule distribution index (MDI) method. After defining the cell boundaries and a central intense point in the cell, a series of lines are drawn from the central point to the periphery. Mean intensities from the inner (Ii) and outer (Io) regions of each drawn line were measured. The MDI for each cell is defined as the average Io/Ii ratio (R) for each line. (C) CHO cells with different HSPB1 levels were stained with α-tubulin and their MDI was calculated (n = >200 cells from three independent stainings). Scale bar = 20 µm.
Figure 5
Figure 5. HSPB1 facilitates the formation of MTs in vitro and binds to MTs at early stages of their polymerization.
(A–B) Coomassie staining of MT cosedimentation assays. Pure tubulin was polymerized in the presence of (A) HSPB1 or (B) GFP for 30 min and fractionated into MT and soluble proteins fraction. Control reactions without tubulin were also used. S = soluble fraction, M = Microtubule fraction. (C) MTs were polymerized from 8 µM or 6 µM MAP-rich tubulin with or without 5 µM HSPB1. MT assembly was monitored by DAPI fluorescence. (D) MT in vitro nucleation assay. 8 µM of a 1∶10 mixture of rhodamine-labeled tubulin and MAP-rich tubulin was polymerized alone or in the presence of different concentrations of recombinant HSPB1 and doublecortin (DCX) for 5 min and spotted onto coverslips. Images from 25 random fields were used to assess number and size of microtubules. All measurements are statistically significant (p<0.01) from each other with the exception of tub:HSPB1(1∶2) and tub:DCX for MT size; and tub:HSPB1(1∶0.5) and tub:DCX for MT number. Scale bar = 20 µm. (E) MTs were polymerized from MAP-rich tubulin in the presence of HSPB1 for 3 and 30 min and visualized by TEM after immunogold staining using an anti-HSPB1 antibody. Scale bar = 50 nm. (E) MTs were polymerized from MAP-rich tubulin in the presence of HSPB1 for 3 and 30 min and visualized by TEM after immunogold staining using an anti-HSPB1 antibody. Scale bar = 50 nm. (F) Quantification of the density of MT-bound gold particles (HSPB1) (n = 105 MTs for 3 min and 110 MTs for 30 min). (G) Scatter plot showing the relationship between MT-bound HSPB1 density and MT length (n = 128 MTs) on MTs polymerized for 3 min. These two parameters showed significant negative correlation (Spearman correlation coefficient = −0.614, p<0.01). Data are presented as average ± SEM. ***p<0.001.

References

    1. Kostenko S, Moens U (2009) Heat shock protein 27 phosphorylation: kinases, phosphatases, functions and pathology. Cell Mol Life Sci 66: 3289–3307. - PMC - PubMed
    1. Sun Y, Macrae TH (2005) The small heat shock proteins and their role in human disease. FEBS J 272: 2613–2627. - PubMed
    1. Evgrafov OV, Mersiyanova I, Irobi J, Van Den Bosch L, Dierick I, et al. (2004) Mutant small heat-shock protein 27 causes axonal Charcot-Marie-Tooth disease and distal hereditary motor neuropathy. Nat Genet 36: 602–606. - PubMed
    1. Almeida-Souza L, Goethals S, De Winter V, Dierick I, Gallardo R, et al. (2010) Increased monomerization of mutant HSPB1 leads to protein hyperactivity in Charcot-Marie-Tooth neuropathy. J Biol Chem 285: 12778–12786. - PMC - PubMed
    1. Almeida-Souza L, Asselbergh B, d’Ydewalle C, Moonens K, Goethals S, et al. (2011) Small heat-shock protein HSPB1 mutants stabilize microtubules in Charcot-Marie-Tooth neuropathy. J Neurosci 31: 15320–15328. - PMC - PubMed

Publication types