

Deducing Underlying Mechanisms from Protein Recruitment Data
- PMID: 23826103
- PMCID: PMC3694963
- DOI: 10.1371/journal.pone.0066590
Deducing Underlying Mechanisms from Protein Recruitment Data
Abstract
By using fluorescent labelling techniques, the distribution and dynamics of proteins can be measured within living cells, allowing to study in vivo the response of cells to a triggering event, such as DNA damage. In order to evaluate the reaction rate constants and to identify the proteins and reactions that are essential for the investigated process, mechanistic models are used, which often contain many proteins and associated parameters and are therefore underdetermined by the data. In order to establish criteria for assessing the significance of a model, we present here a systematic investigation of the information that can be reliably deduced from protein recruitment data, assuming that the complete set of reactions that affect the data of the considered protein species is not known. To this purpose, we study in detail models where one or two proteins that influence each other are recruited to a substrate. We show that in many cases the kind of interaction between the proteins can be deduced by analyzing the shape of the recruitment curves of one protein. Furthermore, we discuss in general in which cases it is possible to discriminate between different models and in which cases it is impossible based on the data. Finally, we argue that if different models fit experimental data equally well, conducting experiments with different protein concentrations would allow discrimination between the alternative models in many cases.
Conflict of interest statement
Figures
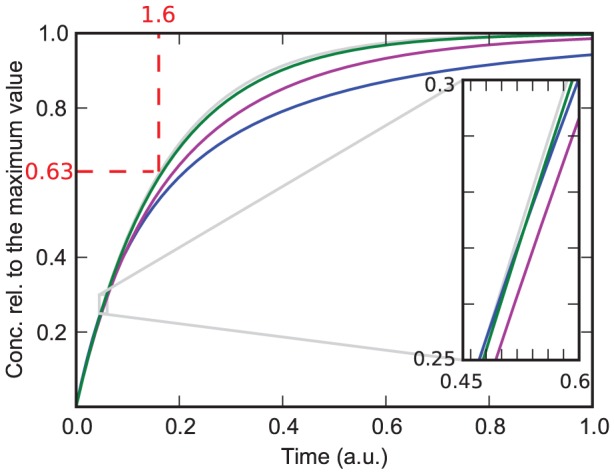
 (eq. (13)) with
  ,
,  ,
,  . The value of
  decreases from the lowest (blue) curve (
 ) to the the highest (green) curve (
 = 500). Grey line: QCA solution (eq. (15)) with
  and
and  . The inset shows the section in which the blue curve and the green curve cross, amplified by a factor of
  . The dashed lines illustrate the parameter estimation described in the main text.
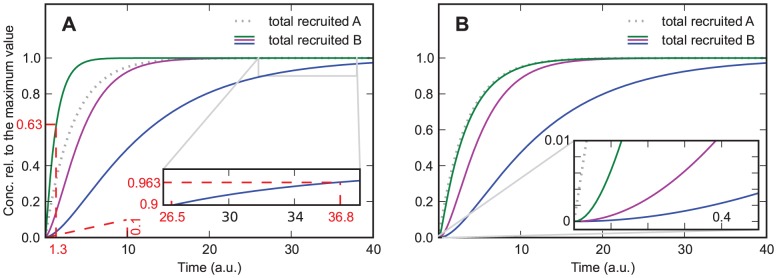
 . Solid lines are for protein
  , the dotted line is for protein
  , and the dashed lines are used for estimating the order of magnitude of the rate constants from the curves, giving
  for the steepest curve, and
  and
and  for the slowest curve. Depending on the parameters the curves show an increasing slope at the beginning. B) same parameters as in A) except
  . The curves always show an increasing slope at the beginning, which helps distinguishing this case from the one shown in Figure 2A. Additionally, for large values of
  the recruitment curves of
  resemble the recruitment curve of
  , which is not the case if
  .
.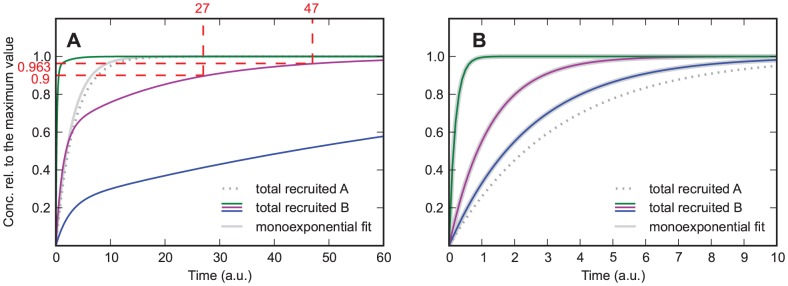
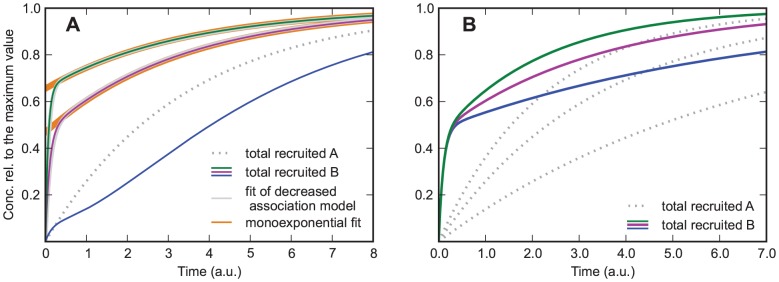
 . Solid lines are for protein
  , the dotted line is for protein
  . The grey line is a monoexponential fit. The dashed lines are used for estimating the rate constants from the curves, giving
  . After
  has risen to a high level, recruitment of
  becomes much slower, and the slope of the recruitment curve of
  (purple curve) decreases faster than would be expected from a monoexponential curve that has a similar initial slope (grey curve). B) same parameters as in A) except
  . The curves always resemble a monoexponential function.
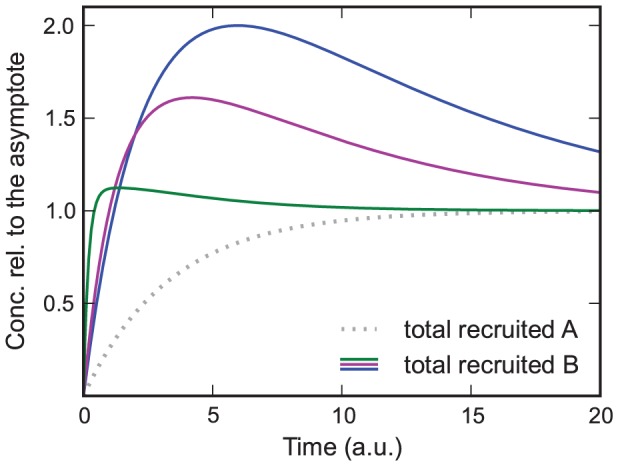
 . In contrast to the previous models, the recruitment curves of this model have a maximum that is larger than the plateau value if
  and
and  .
.
 ,
,  from bottom to top curve,
  ,
,  . Grey curves: Fits of the model in which protein
  decreases the association rate of protein
  . Orange curves: Monoexponential fit with an intercept. Decreasing
  leads to a new feature, which is characterized by a decline of the slope followed by an increase. Since this feature can not occur in the model in which protein
  decreases the association rate, it allows distinguishing between the model in which protein
  decreases the association rate and the model in which it decreases the dissociation rate. B) same parameters as in subfigure A, but
  from bottom to top and
  . Despite of the variation in
  , the time at which the bend occurs is the same for all curves.
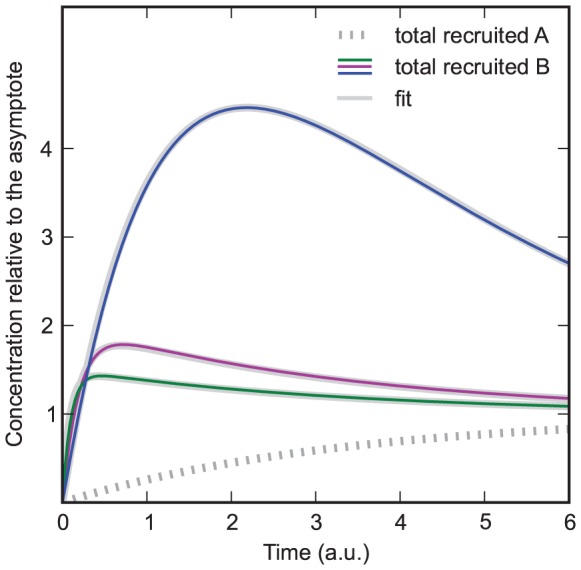
 decreases the association rate of
  and in which dissociation is relevant (section B1.3).
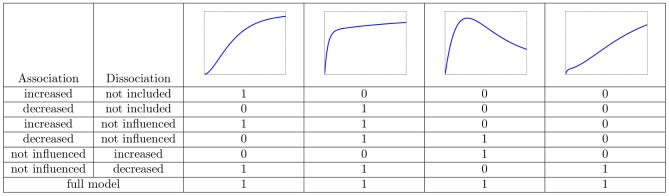
Similar articles
-
Examination of shape complementarity in docking of unbound proteins.Proteins. 1999 Aug 15;36(3):307-17. Proteins. 1999. PMID: 10409824
-
Dynamics of protofibril elongation and association involved in Aβ42 peptide aggregation in Alzheimer's disease.BMC Bioinformatics. 2010 Oct 7;11 Suppl 6(Suppl 6):S24. doi: 10.1186/1471-2105-11-S6-S24. BMC Bioinformatics. 2010. PMID: 20946608 Free PMC article.
-
Auto-FACE: an NMR based binding site mapping program for fast chemical exchange protein-ligand systems.PLoS One. 2010 Feb 18;5(2):e8943. doi: 10.1371/journal.pone.0008943. PLoS One. 2010. PMID: 20174626 Free PMC article.
-
Model-based inference of biochemical parameters and dynamic properties of microbial signal transduction networks.Curr Opin Biotechnol. 2011 Feb;22(1):109-16. doi: 10.1016/j.copbio.2010.09.014. Epub 2010 Oct 20. Curr Opin Biotechnol. 2011. PMID: 20970318 Review.
-
Protein Binding Pocket Dynamics.Acc Chem Res. 2016 May 17;49(5):809-15. doi: 10.1021/acs.accounts.5b00516. Epub 2016 Apr 25. Acc Chem Res. 2016. PMID: 27110726 Review.
Cited by
-
New Methodologies to Study DNA Repair Processes in Space and Time Within Living Cells.Front Cell Dev Biol. 2021 Sep 13;9:730998. doi: 10.3389/fcell.2021.730998. eCollection 2021. Front Cell Dev Biol. 2021. PMID: 34589495 Free PMC article. Review.
-
Discrimination of Kinetic Models by a Combination of Microirradiation and Fluorescence Photobleaching.Biophys J. 2015 Oct 20;109(8):1551-64. doi: 10.1016/j.bpj.2015.08.031. Biophys J. 2015. PMID: 26488646 Free PMC article.
References
-
- Tobias F, Durante M, Taucher-Scholz G, Jakob B (2010) Spatiotemporal analysis of dna repair using charged particle radiation. Mutation Research 704: 54–60. - PubMed
-
- Carrero G, McDonald D, Crawford E, de Vries G, Hendzel M (2003) Using frap and mathematical modeling to determine the in vivo kinetics of nuclear proteins. Methods 29: 14–28. - PubMed
Publication types
MeSH terms
Substances
LinkOut - more resources
Full Text Sources
Other Literature Sources
