. 2013 Jun 24;8(6):e66738.
doi: 10.1371/journal.pone.0066738. Print 2013.

Fluorescence lifetime imaging of alterations to cellular metabolism by domain 2 of the hepatitis C virus core protein

Affiliations

Fluorescence lifetime imaging of alterations to cellular metabolism by domain 2 of the hepatitis C virus core protein

Nirmal Mazumder et al. PLoS One. .

Abstract

Hepatitis C virus (HCV) co-opts hepatic lipid pathways to facilitate its pathogenesis. The virus alters cellular lipid biosynthesis and trafficking, and causes an accumulation of lipid droplets (LDs) that gives rise to hepatic steatosis. Little is known about how these changes are controlled at the molecular level, and how they are related to the underlying metabolic states of the infected cell. The HCV core protein has previously been shown to independently induce alterations in hepatic lipid homeostasis. Herein, we demonstrate, using coherent anti-Stokes Raman scattering (CARS) microscopy, that expression of domain 2 of the HCV core protein (D2) fused to GFP is sufficient to induce an accumulation of larger lipid droplets (LDs) in the perinuclear region. Additionally, we performed fluorescence lifetime imaging of endogenous reduced nicotinamide adenine dinucleotides [NAD(P)H], a key coenzyme in cellular metabolic processes, to monitor changes in the cofactor's abundance and conformational state in D2-GFP transfected cells. When expressed in Huh-7 human hepatoma cells, we observed that the D2-GFP induced accumulation of LDs correlated with an increase in total NAD(P)H fluorescence and an increase in the ratio of free to bound NAD(P)H. This is consistent with an approximate 10 fold increase in cellular NAD(P)H levels. Furthermore, the lifetimes of bound and free NAD(P)H were both significantly reduced--indicating viral protein-induced alterations in the cofactors' binding and microenvironment. Interestingly, the D2-expressing cells showed a more diffuse localization of NAD(P)H fluorescence signal, consistent with an accumulation of the co-factor outside the mitochondria. These observations suggest that HCV causes a shift of metabolic control away from the use of the coenzyme in mitochondrial electron transport and towards glycolysis, lipid biosynthesis, and building of new biomass. Overall, our findings demonstrate that HCV induced alterations in hepatic metabolism is tightly linked to alterations in NAD(P)H functional states.


Conflict of interest statement

Competing Interests: The authors have declared that no competing interests exist.

Figures

Figure 1
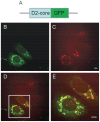
Figure 1. Domain 2 of HCV core protein induces lipid accumulation in Huh7 cells.
Huh7 cells were fixed and imaged by CARS and TPF microscopy 24 hours post-transfection with D2-GFP fusion protein. (A) Diagram of the HCV D2-GFP fusion protein. (B)–(E) Simultaneous CARS and two-photon fluorescence image of Huh7 cells expressing D2-GFP. (B) Typical two-photon fluorescence image showing localization of D2-GFP (green); (C) CARS image of lipid droplets (red) in the same field of view; (D) Overlay of the CARS and two-photon fluorescence images; (E) Magnified image from the inset of (D). Representative images are shown of three biological replicates. Scale bar = 10 µm.
Figure 2
Figure 2. Domain 2 of HCV core protein increases NAD(P)H fluorescence.
Huh7 cells were transfected with plasmids encoding D2-GFP or GFP. The cells were fixed and imaged 24 hours post-transfection with TPF for NAD(P)H fluorescence, DIC, and CCD camera for GFP fluorescence. (A) Left panels: Grayscale images of NAD(P)H fluorescence intensity signals. Right panels: Overlay of DIC images and GFP fluorescence (red). Representative images are shown from two biological replicates. Scale bar = 10 µm. (B) Quantitative analysis of NAD(P)H fluorescence intensity in D2-GFP transfected cells and neighbouring non-transfected cells. Error bars represent standard deviation (n≥3; **p<0.01).
Figure 3
Figure 3. Domain 2 of HCV core induces alterations in NAD(P)H microenvironment.
Huh7 cells were transfected with either D2-GFP or GFP. The cells were imaged 24 hours post-transfection with FLIM for NAD(P)H lifetimes, DIC, and CCD camera for GFP fluorescence. (A) Left panels: Pseudo-colored images of average NAD(P)H lifetimes. Right panels: Overlay of DIC images and GFP fluorescence (red). Representative images are shown of two biological replicates. Scale bar = 10 µm. (B) Quantitative analysis of NAD(P)H mean lifetimes. (C)–(D) Quantitative analysis of average lifetimes for (C) free and (D) bound NAD(P)H in GFP or D2-GFP expressing cells and non-transfected neighbouring cells. Error bars represent standard deviation (n≥12; ***p<0.001).
Figure 4
Figure 4. D2 expression induces enrichment for short lifetime forms of NAD(P)H.
Huh7 cells were transfected with either D2-GFP or GFP alone. Cells were imaged 24 hours post-transfection with FLIM for NAD(P)H lifetimes, DIC, and CCD camera for GFP fluorescence. (A) Overlay of DIC images and GFP fluorescence (red) are shown in right panels. Pseudo-colored images of the fraction of the fast decaying component (short lifetime) are shown in the left panels. The fraction was calculated as described in Materials and Methods. The range goes from 0 to 0.85 in evenly spaced increments on the colour scale. Pixels with less than 20 counts were set to 0. Scale bar = 10 µm. (B) Quantitative analysis of ratio of a1/a2 in Huh7 cells. ROIs (n≥12; ***p<0.001) were taken from two independent experiments. Error bars represent standard deviation.
Figure 5
Figure 5. Proposed model of HCV core D2-induced alterations in metabolic homeostasis.
The observed increase in NAD(P)H levels can be attributed to several plausible mechanisms . HCV core D2 association with the outer mitochondrial membrane (OMM) modulates calcium ion (Ca2+) transporters’ activity. This interaction can elicit calcium ion influx into the mitochondrial matrix, which results in increased reactive oxygen species (ROS). Subsequent accumulation of oxidized glutathione (GSSG) and its association with Complex I can lead to disruption of the electron transport chain (ETC). D2 may also directly interaction with Complex I or NDUFS2 to inhibit Complex I activity, resulting in increased reduced NADH . The increased NAD(P)H may allow for increased lipid biosynthesis or a shift to glycolysis within infected cells. This alteration in the cofactor’s protein binding and localization can account for changes in the NAD(P)H lifetimes observed.

References

    1. Crespo G, Marino Z, Navasa M, Forns X (2012) Viral hepatitis in liver transplantation. Gastroenterology 142: 1373–1383 e1371. - PubMed
    1. El-Serag HB (2012) Epidemiology of viral hepatitis and hepatocellular carcinoma. Gastroenterology 142: 1264–1273 e1261. - PMC - PubMed
    1. Hoofnagle JH (2002) Course and outcome of hepatitis C. Hepatology. 36: s21–s29. - PubMed
    1. Lindenbach BD, Rice CM (2005) Unravelling hepatitis C virus replication from genome to function. Nature 436: 933–938. - PubMed
    1. Assis DN, Lim JK (2012) New Pharmacotherapy for Hepatitis C. Clin Pharmacol Ther. 92: 294–305. - PubMed

Publication types

LinkOut - more resources