. 2013 Jun 24;8(6):e66816.
doi: 10.1371/journal.pone.0066816. Print 2013.

Dietary alleviation of maternal obesity and diabetes: increased resistance to diet-induced obesity transcriptional and epigenetic signatures

Affiliations

Dietary alleviation of maternal obesity and diabetes: increased resistance to diet-induced obesity transcriptional and epigenetic signatures

Linda Attig et al. PLoS One. .

Abstract

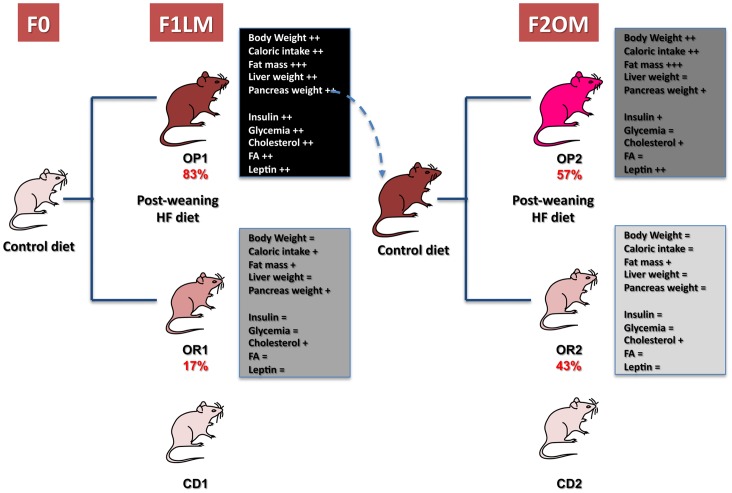
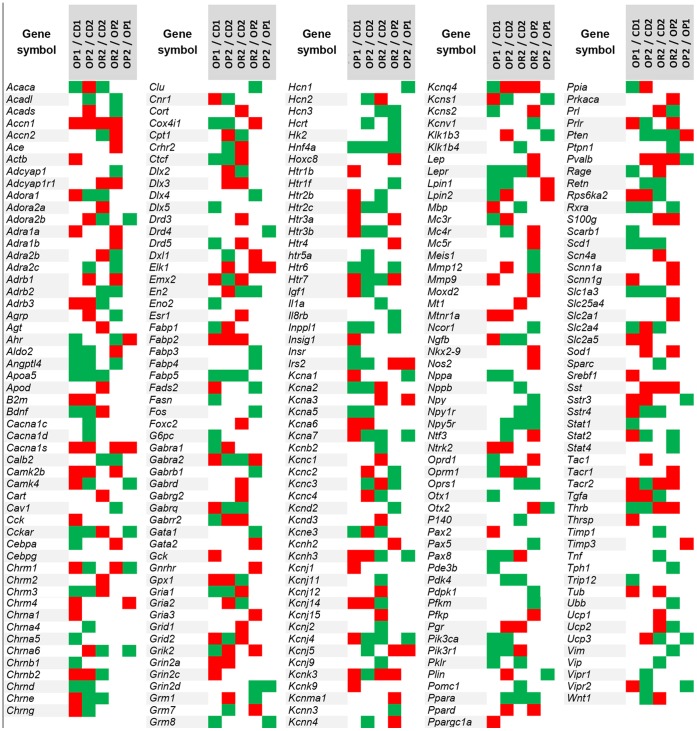
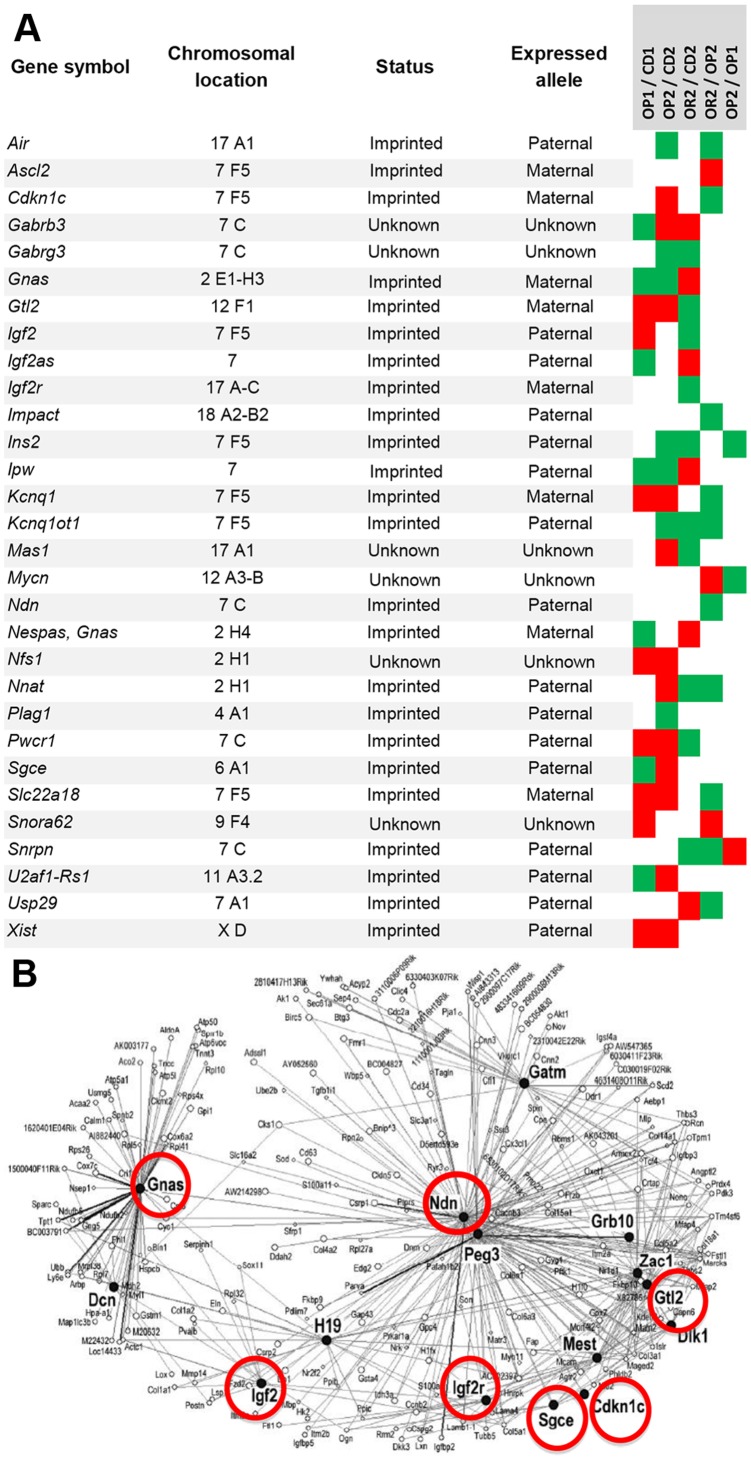
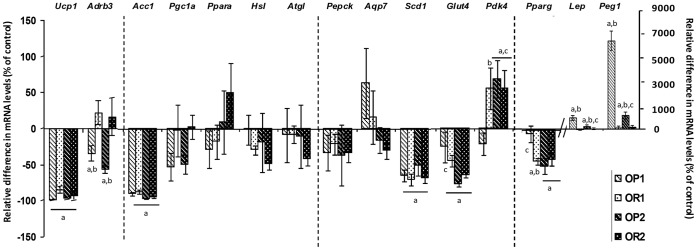
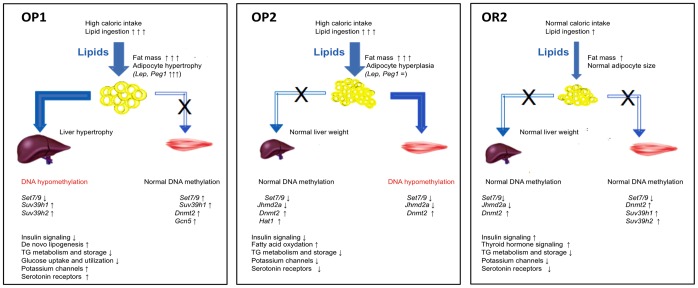
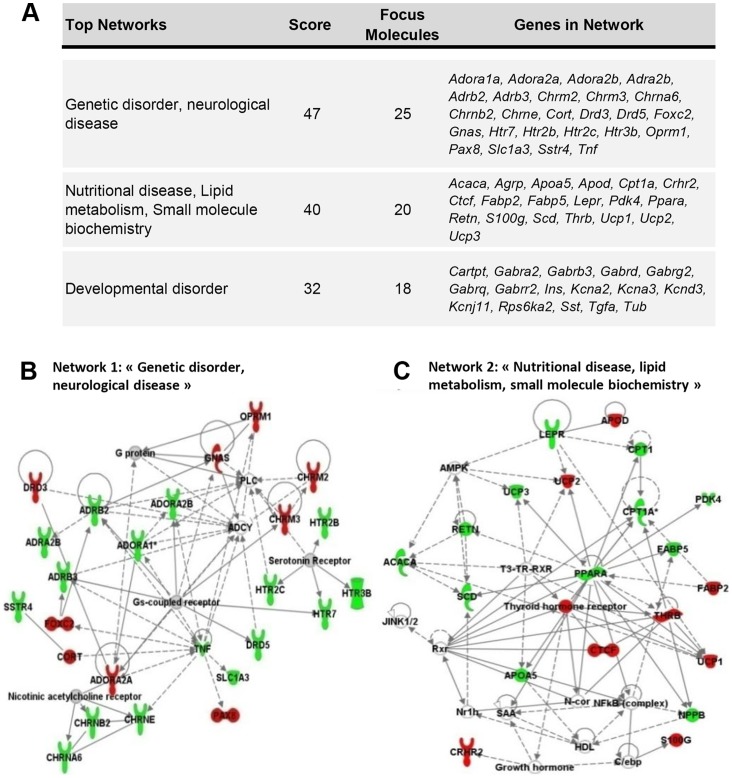
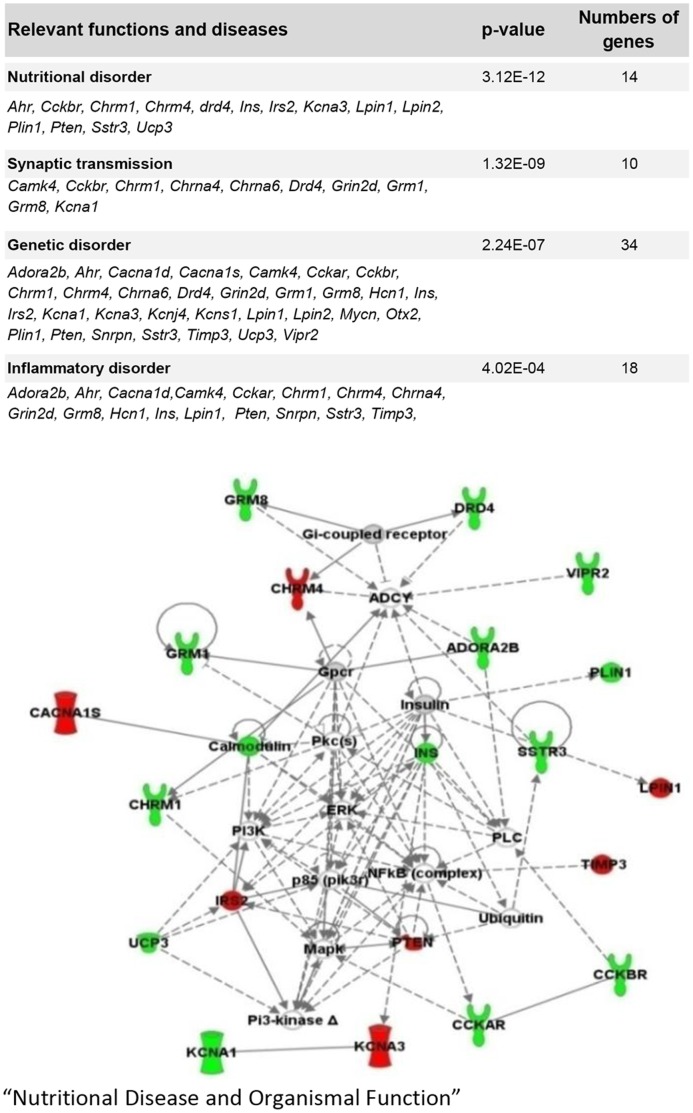
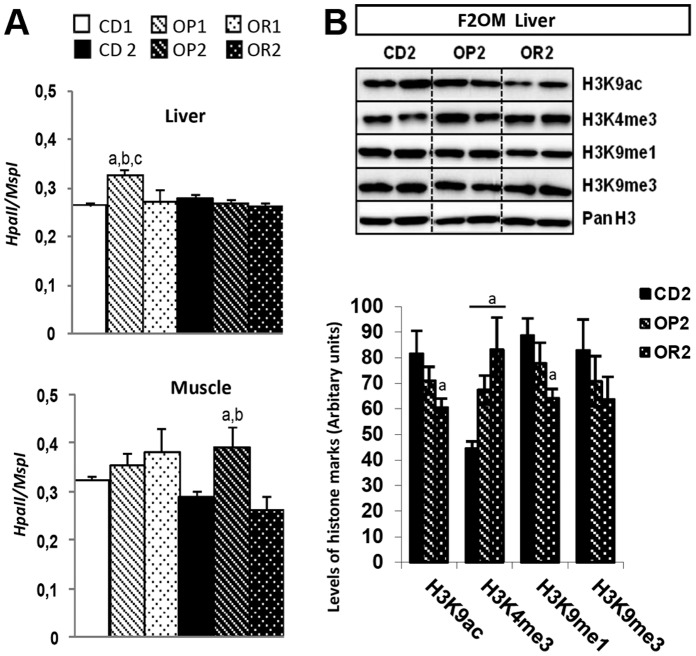
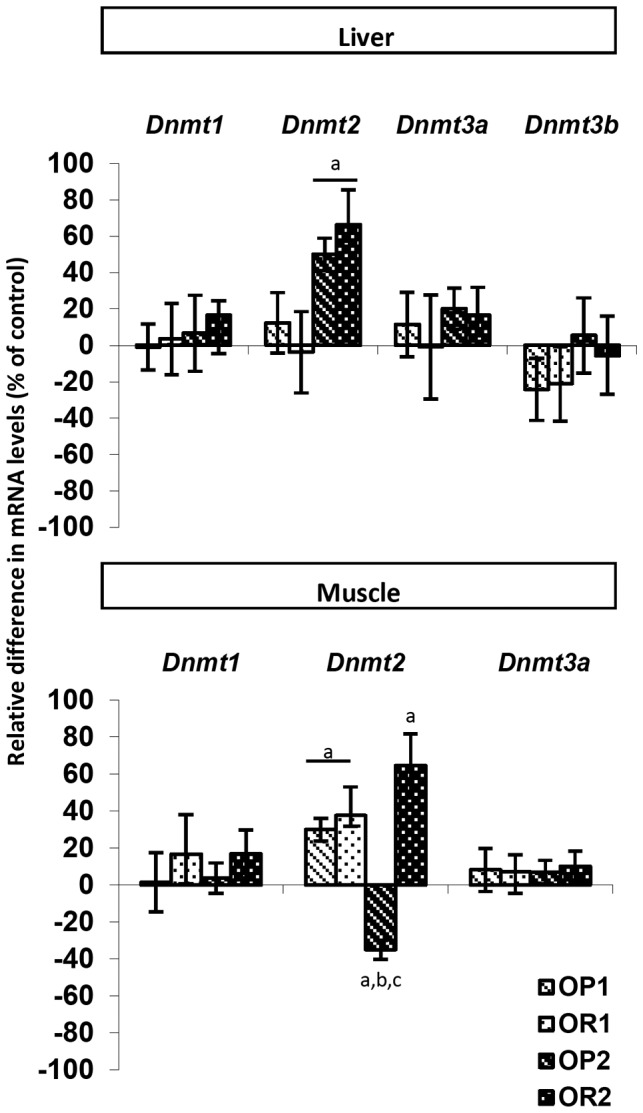
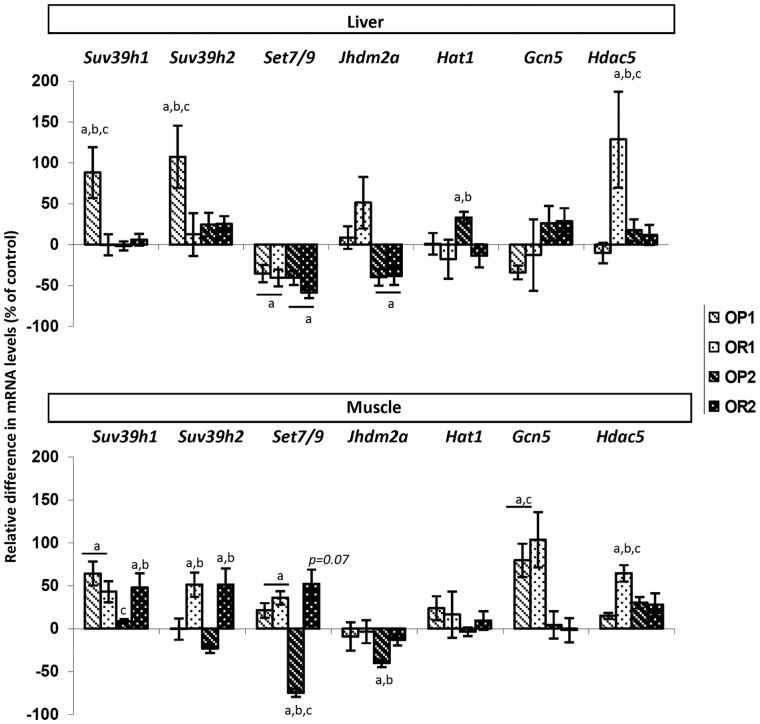
According to the developmental origins of health and diseases (DOHaD), and in line with the findings of many studies, obesity during pregnancy is clearly a threat to the health and well-being of the offspring, later in adulthood. We previously showed that 20% of male and female inbred mice can cope with the obesogenic effects of a high-fat diet (HFD) for 20 weeks after weaning, remaining lean. However the feeding of a control diet (CD) to DIO mice during the periconceptional/gestation/lactation period led to a pronounced sex-specific shift (17% to 43%) from susceptibility to resistance to HFD, in the female offspring only. Our aim in this study was to determine how, in the context of maternal obesity and T2D, a CD could increase resistance on female fetuses. Transcriptional analyses were carried out with a custom-built mouse liver microarray and by quantitative RT-PCR for muscle and adipose tissue. Both global DNA methylation and levels of pertinent histone marks were assessed by LUMA and western blotting, and the expression of 15 relevant genes encoding chromatin-modifying enzymes was analyzed in tissues presenting global epigenetic changes. Resistance was associated with an enhancement of hepatic pathways protecting against steatosis, the unexpected upregulation of neurotransmission-related genes and the modulation of a vast imprinted gene network. Adipose tissue displayed a pronounced dysregulation of gene expression, with an upregulation of genes involved in lipid storage and adipocyte hypertrophy or hyperplasia in obese mice born to lean and obese mothers, respectively. Global DNA methylation, several histone marks and key epigenetic regulators were also altered. Whether they were themselves lean (resistant) or obese (sensitive), the offspring of lean and obese mice clearly differed in terms of several metabolic features and epigenetic marks suggesting that the effects of a HFD depend on the leanness or obesity of the mother.


Conflict of interest statement

Competing Interests: We have the following interest. We received funding from two commercial sources, Fournier laboratory and Nestlé as fellowship to C. Gallou-Kabani and A. Vige in 2004 and 2006 respectively. This does not alter the authors' adherence to all the PLOS ONE policies on sharing data and materials.

Figures

Figure 1
Figure 1. Schematic diagram summarizing the step-by-step evolution of the metabolic phenotype of OR and OP mice in the F1LM and F2OM offspring.
Figure 2
Figure 2. Heat map construction representing the differential expression of genes involved in metabolic function and neurotransmission.
The heat map shows changes in the hepatic expression of genes encoding proteins involved in neurotransmission and genes encoding energy homeostasis-related proteins. Red, green and white squares represent upregulated, downregulated and unmodified genes, respectively.
Figure 3
Figure 3. Heat map construction representing differentially expressed imprinted genes.
(A) The heat map shows the changes in expression of imprinted genes in the liver in response to the HFD (OP1/CD1, OP2/CD2, OR2/CD2), with the trait of susceptibility/resistance to the obesogenic effects of HFD (OR2/OP2; indirect comparisons OR2/CD2 and OP2/CD2), or with a maternal effect (lean versus obese mother) (OP1/OP2); indirect comparisons (OP1/CD1 and OP2/CD2). Red, green and white squares represent upregulated, downregulated and unmodified genes, respectively. The status of the imprinted gene and the preferred parental allele for gene expression presented in this table at this time may subsequently be modified, as knowledge in this domain increases. Updates accessible via www.geneimprint.com). (B) Representation of the IGN network as described by Varrault et al. . Red circles indicate the genes modulated in OR2 mice in response to the HFD and associated with maintenance of the lean phenotype (comparisons OR2/CD2 and OR2/OP2).
Figure 4
Figure 4. Analysis of mRNA levels for key adipogenic genes by RT-qPCR on the adipose tissue of mice fed either the CD or the HFD, born to either lean or obese/diabetic mothers (F1LM and F2OM).
The values shown are the ratios between OP1 or OR1 and CD1 and between OP2 or OR2 and CD2 (Figures 9 and 10). They are expressed as the mean±SEM, n = 6 per group. a p<0.05 for comparison with control CD, b p<0.05 for comparison between OP and OR mice, c p<0.05 for comparison between F1LM and F2OM, assessed by Kruskal-Wallis tests followed by post hoc Dunn’s tests.
Figure 5
Figure 5. Schematic diagram summarizing the transcriptional data obtained for the liver, muscle and adipose tissue and the results of epigenetic studies in OP1, OP2 and OR2 mice.
Blue arrows represent potential lipid fluxes. In the hyperphagic OP1 and OP2 mice, lipid ingestion was much greater than in OR2 mice, in which caloric intake was normalized. In OP mice, excess lipids were initially stored in the adipose tissue, leading to adipocyte hypertrophy in OP1 mice and hyperplasia in OP2 mice, as a function of the level of expression of Lep and Peg1. In OR2 mice, lipids were stored in the adipose tissue without adipocyte abnormalities or ectopic storage, as in mice supplied with limited amounts of lipid. In OP1 mice, the excess lipids were stored in the liver, contributing to hepatic hypertrophy. Transcriptomic data indicated that de novo lipogenesis was activated in OP1 mice and that insulin signaling was greatly disturbed. In OP2 mice, genes related to insulin signaling were less affected, whereas genes involved in fatty acid oxidation were globally upregulated. Changes to hepatic metabolism, together with the probable redirection of lipids to muscle thus spared the liver from lipid accumulation. Finally, in OR2 mice, lipid metabolism as a whole was downregulated, whereas thyroid hormone signaling was upregulated. The HFD response was also associated, in OP1 mice, with an upregulation of potassium channels and serotonin receptors, subsequently reversed in both OP2 and OR2 mice. Changes in DNA methylation were observed in the livers of OP1 mice and the muscle of OP2 mice. In the liver, Set7/9 expression was decreased by the HFD in mice born to either lean or obese/diabetic mothers (F1LM and F2OM), whether OP or OR. In the livers of OP1 mice, DNA hypomethylation was associated with an upregulation of Suv39h1 and Suv39h2 expression, whereas, in both OR2 and OP2 mice, normal DNA methylation was associated with a decrease in Jhdm2a expression and an increase in the level of Dnmt2 mRNA. In muscle, normal DNA methylation was associated with an upregulation of Suv39h1, Set7/9 and Dnmt2 in OP1 and OR2 mice, contrasting with the lower level of expression of the Set7/9 and Dnmt2 genes in the muscle of OP2 mice presenting DNA hypomethylation.
Figure 6
Figure 6. Resistance to the obesogenic effects of the HFD: Major networks identified by IPA analysis of the genes involved in the response and adaptation to HFD of OR2 mice.
(A) These networks were built from the 142 genes differentially expressed between OR2 and CD2 mice (direct comparison OR2/CD2). Only the first two networks are represented in (B) and (C). The node color indicates the level of expression of the genes: red, upregulated; green, downregulated.
Figure 7
Figure 7. Maternal effect (lean versus obese mother): Relevant functions and diseases, and representation of the major network of interaction identified by IPA analysis of the genes differentially expressed between OP1 and OP2 obese mice.
The 35 genes differentially expressed between the obese mice born to lean and obese/diabetic mothers (F1LM and F2OM) obtained in the direct OP2/OP1 comparison were subjected to IPA analysis. The network shown contains 20 focal genes with a score of 50. The node color indicates the expression levels of genes: red, upregulated; green, downregulated.
Figure 8
Figure 8. Analysis of global epigenetic modifications in several organs of mice fed either the CD or the HFD, born to either lean or obese/diabetic mothers (F1LM and F2OM).
(A) Global DNA methylation analysis by LUMA in the liver and muscle of CD, OR and OP females, HpaII/MspI levels indicate the degree of CCGG unmethylation. (B) Global analysis of posttranslational histone modifications by western blotting, for the liver of F2OM females. The values shown are the mean±SEM. a p<0.05 for comparison with control CD, b p<0.05 for comparison between OP and OR mice, c p<0.05 for comparison between the F1LM and F2OM mice born to lean and obese mothers, respectively, assessed by Kruskal-Wallis tests and post hoc Dunn’s tests.
Figure 9
Figure 9. Analysis, by RT-qPCR, of the expression of genes encoding DNA methyltransferase enzymes in the liver and muscle of mice fed the HFD, born to either lean or obese/diabetic mothers (F1LM and F2OM).
The values shown are the ratios between OP1 or OR1 and CD1 and between OP2 or OR2 and CD2. They are expressed as the mean±SEM, n = 8 per group. a p<0.05 for comparison with control CD, b p<0.05 for comparison between OP and OR mice, c p<0.05 for comparison between the F1LM and F2OM born to lean and obese/diabetic mothers, respectively, assessed by Kruskal-Wallis tests and post hoc Dunn’s tests.
Figure 10
Figure 10. Analysis, by RT-qPCR, of the expression of genes encoding histone-modifying enzymes in the liver and muscle of mice fed the HFD, for both lean and obese mothers.
The values shown are the ratios between OP1 or OR1 and CD1 and between OP2 or OR2 and CD2. They are expressed as the mean±SEM, n = 8 per group. a p<0.05 for comparison with control CD, b p<0.05 for comparison between OP and OR mice, c p<0.05 for comparison between the F1LM and F2OM (maternal effect: lean versus obese mother), assessed by Kruskal-Wallis tests and post hoc Dunn’s tests.

References

    1. Barker DJ, Osmond C (1988) Low birth weight and hypertension. BMJ 297: 134–135. - PMC - PubMed
    1. McMillen IC, Robinson JS (2005) Developmental origins of the metabolic syndrome: prediction, plasticity, and programming. Physiol Rev 85: 571–633. - PubMed
    1. Armitage JA, Taylor PD, Poston L (2005) Experimental models of developmental programming: consequences of exposure to an energy rich diet during development. J Physiol 565: 3–8. - PMC - PubMed
    1. Nathanielsz PW, Poston L, Taylor PD (2007) In utero exposure to maternal obesity and diabetes: animal models that identify and characterize implications for future health. Obstet Gynecol Clin North Am 34: 201–212, vii–viii. - PubMed
    1. Levin BE, Govek E (1998) Gestational obesity accentuates obesity in obesity-prone progeny. Am J Physiol 275: R1374–1379. - PubMed

Publication types

MeSH terms