. 2013 Jun 24;8(6):e67234.
doi: 10.1371/journal.pone.0067234. Print 2013.

ILDR2: an endoplasmic reticulum resident molecule mediating hepatic lipid homeostasis

Affiliations

ILDR2: an endoplasmic reticulum resident molecule mediating hepatic lipid homeostasis

Kazuhisa Watanabe et al. PLoS One. .

Abstract

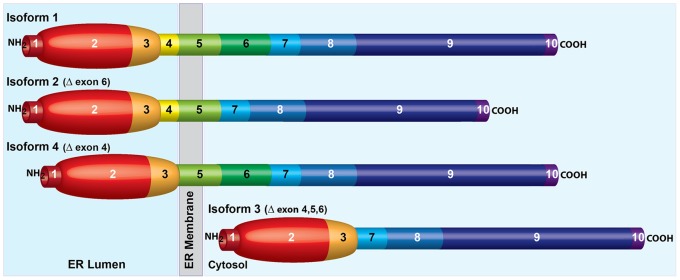
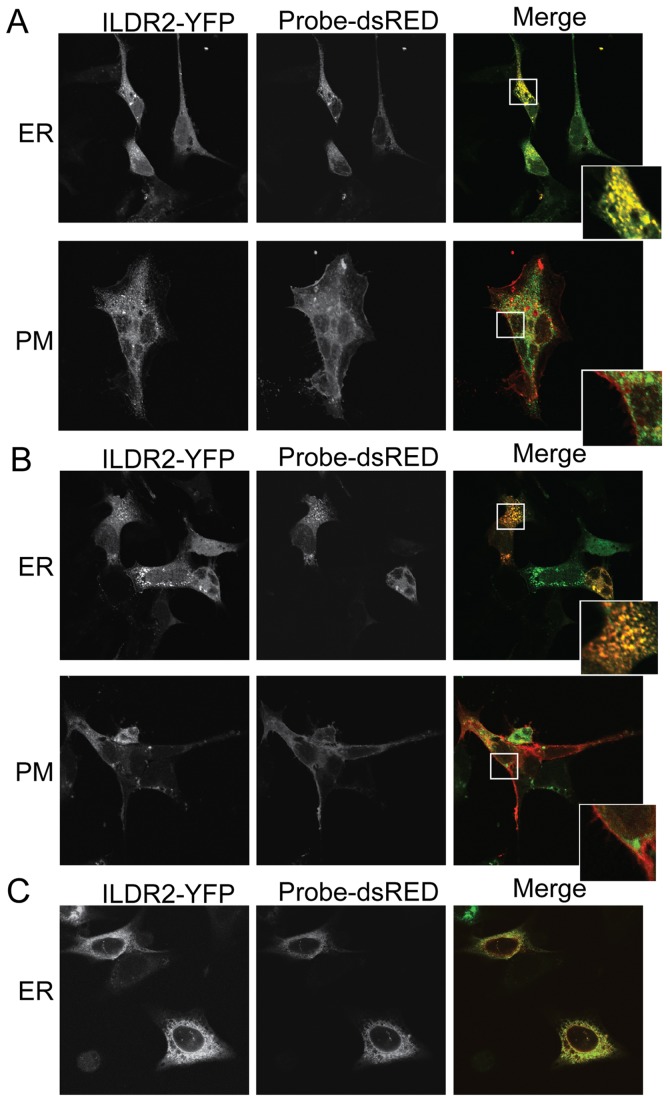
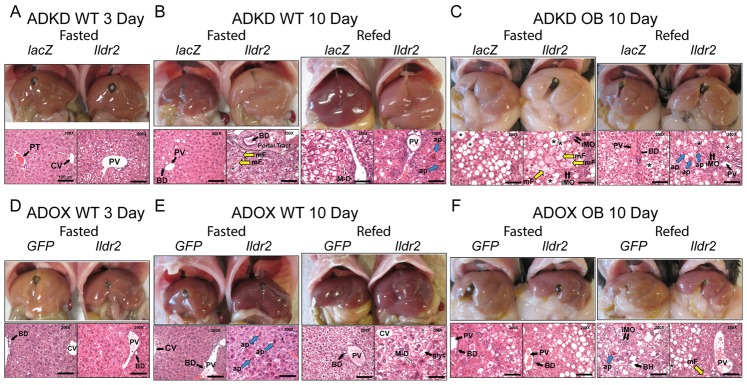
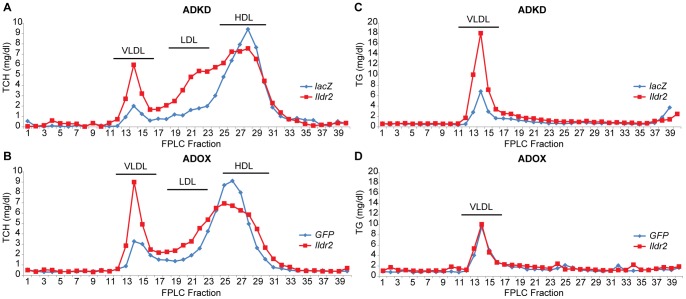
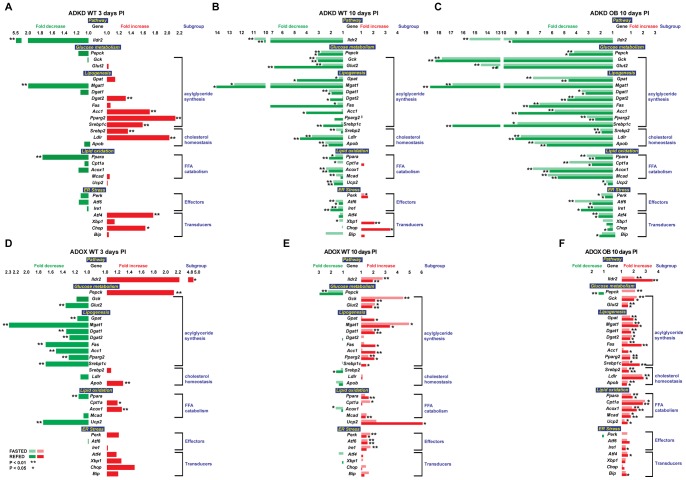
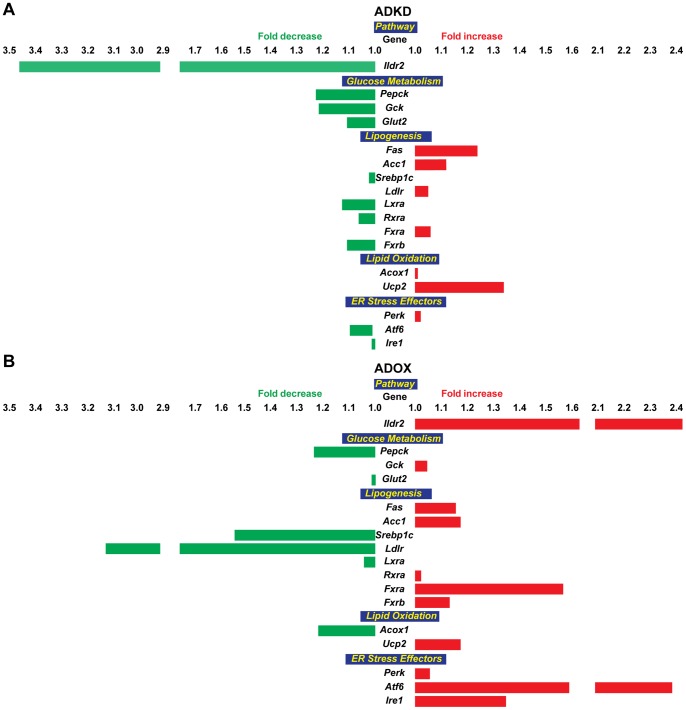
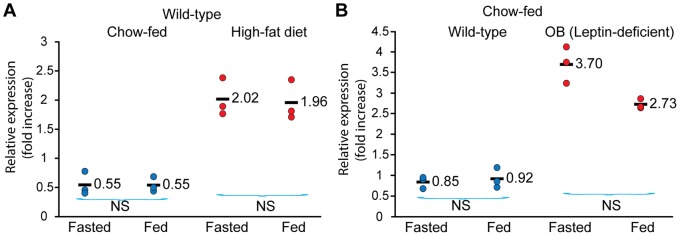
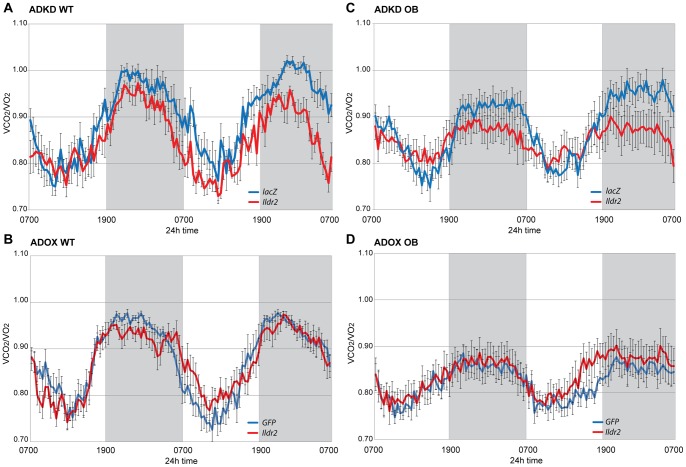
Ildr2, a modifier of diabetes susceptibility in obese mice, is expressed in most organs, including islets and hypothalamus, with reduced levels in livers of diabetes-susceptible B6.DBA mice congenic for a 1.8 Mb interval of Chromosome 1. In hepatoma and neuronal cells, ILDR2 is primarily located in the endoplasmic reticulum membrane. We used adenovirus vectors that express shRNA or are driven by the CMV promoter, respectively, to knockdown or overexpress Ildr2 in livers of wild type and ob/ob mice. Livers in knockdown mice were steatotic, with increased hepatic and circulating triglycerides and total cholesterol. Increased circulating VLDL, without reduction in triglyceride clearance suggests an effect of reduced hepatic ILDR2 on hepatic cholesterol clearance. In animals that overexpress Ildr2, hepatic triglyceride and total cholesterol levels were reduced, and strikingly so in ob/ob mice. There were no significant changes in body weight, energy expenditure or glucose/insulin homeostasis in knockdown or overexpressing mice. Knockdown mice showed reduced expression of genes mediating synthesis and oxidation of hepatic lipids, suggesting secondary suppression in response to increased hepatic lipid content. In Ildr2-overexpressing ob/ob mice, in association with reduced liver fat content, levels of transcripts related to neutral lipid synthesis and cholesterol were increased, suggesting "relief" of the secondary suppression imposed by lipid accumulation. Considering the fixed location of ILDR2 in the endoplasmic reticulum, we investigated the possible participation of ILDR2 in ER stress responses. In general, Ildr2 overexpression was associated with increases, and knockdown with decreases in levels of expression of molecular components of canonical ER stress pathways. We conclude that manipulation of Ildr2 expression in liver affects both lipid homeostasis and ER stress pathways. Given these reciprocal interactions, and the relatively extended time-course over which these studies were conducted, we cannot assign causal primacy to either the effects on hepatic lipid homeostasis or ER stress responses.


Conflict of interest statement

Competing Interests: The authors have declared that no competing interests exist. The work described in this submission is related to U.S. Nonprovisional Utility Patent Application 12/747,866 (filed June 6, 2010) “Methods for Identifying Compounds that Modulate LISCH-like Protein or C1ORF32 Protein Activity and Methods of Use”. This does not alter the authors’ adherence to all the PLOS ONE policies on sharing data and materials, as detailed online in the guide for authors.

Figures

Figure 1
Figure 1. Predicted structure of major ILDR2 isoforms.
Isoform 1 (GenBank: FJ024495.1) is full-length. There are 10 predicted exons. Exon 1 is an amino terminal signal peptide; exons 2 and 3 code for an IgV-like immunoglobulin domain; exon 4 is amino proximal to the trans-membrane domain of exon 5; exons 6–10 comprise a randomly-coiled, carboxy-terminal tail (simplified in this depiction as rod-like). Based on results shown in Figure 2 , exons 1–4 are lumenal and exons 6–10 are cytosolic. Isoform 2 (GenBank: FJ024496.1) lacks cytosolic exon 6. Isoform 4 (GenBank: FJ024498.1) lacks lumenal exon 4. Isoform 3 (GenBank: FJ024497.1) lacks exons 4, 5, and 6 and, therefore has no trans-membrane domain, and is depicted as entirely cytosolic.
Figure 2
Figure 2. Fluorescence microscopy of ILDR2 localization under basal conditions.
ILDR2 fused on its C-terminus to mYFP (green) was transiently co-transduced into cell lines with DsRed-probes specific to either the ER (red) or the PM (red). The ER-specific probe is DsRed fluorescent protein attached to the ER-retention sequence KDEL. The PM-specific probe is DsRED attached to a farnesyl group that targets the protein to the inner leaflet of the PM. Cells were fixed without any further treatment 24 hr after transfection. Bar: 100 uM. Confocal images recorded at 63× magnification. (A) GT1-7 cells. ILDR2-isoform 2-YFP merges with DsRed-ER probe to produce a yellow signal over the ER, but does not merge with the red DsRed-PM probe. (B) Hepa1c1c7 cells. The green ILDR2-isoform 4-YFP probe merges with the red DsRed-ER probe to produce an orange signal over the ER; expression levels of labeled proteins are less uniform than in GT1-7 cells. The red DsRed-PM and green ILDR2-YFP signals do not merge in the PM. (C) Hepa1c1c7 cells. N-terminal fusion of ILDR2-isoform 1 with 3xFLAG epitope co-transduced with DsRed-probes to ER. Tag geometry does not interfere with subcellular localization.
Figure 3
Figure 3. Liver morphology and histology in ADKD and ADOX WT and OB mice.
Chow-fed, 10-week-old B6 males were sacrificed after 24-hr fast (Fasted) or following a 24-hr fast and 12-hr refeeding (Refed). Liver morphology is shown in the upper panels and hematoxylin and eosin staining of representative sections is shown in the lower panels at 200X magnification (scale is 100 µm). Asterisk (*) identifies large droplet, macrovesicular lipid vacuoles, particularly evident in Ob sections; large open arrows (M-D) denote intra-hepatocellular Mallory-Denk-like eosinophilic material; open yellow arrows (mF) denote small droplet, microvesicular fat within hepatocytes; short double black arrows (iMO) indicate mononuclear inflammatory cells, consistent with lymphocytes; large blue arrows (ap) indicate apoptotic hepatocytes; (glyc) identifies a “clear”-appearing hepatocyte with increased glycogen content (e.g., ADOX WT 10d Refed); Portal Tract (or PT) is above the hatched line in ADKD WT 10d Fasted); (CV) is Central Vein; (PV) is Portal Vein; (BD) is Bile Duct. (A) Wild-type mice, 3 days p.t. with adenovirus knockdown vectors expressing RNAi for lacZ or Ildr2 (B) Wild-type mice, 10 days p.t. with adenovirus knockdown vectors expressing RNAi for lacZ or Ildr2 (C) ob/ob mice, 10 days p.t. with adenovirus knockdown vectors expressing RNAi for lacZ or Ildr2 (D) Wild-type mice, 3 days p.t. with adenovirus vector over-expressing GFP or Ildr2; there is no significant steatosis or inflammation (E) Wild-type mice, 10 days p.t. with adenovirus vector over-expressing GFP or Ildr2 (F) ob/ob mice, 10 days p.t. with adenovirus vector over-expressing GFP or Ildr2. As described in the text, increased apoptosis without inflammation is consistent with a primary role for ILDR2 in ER stress responses.
Figure 4
Figure 4. TG secretion analysis in ADKD and ADOX WT mice.
Chow-fed, 10-week-old B6 (WT) males were intravenously injected with ADKD or ADOX vectors expressing RNAi for lacZ or Ildr2. At 7 days p.t., following a 16 hr fast, mice were intravenously injected with 15% Triton WR1339 at a dose of 500 mg/kg. Plasma (from 100 ul of blood) was collected hourly for 4 hr and TG measured. (A) Wild-type mice, 7 days p.t. with adenovirus knockdown vector expressing RNAi for lacZ or Ildr2; (B) Wild-type mice, 7 days post- transduction with adenovirus vector over-expressing GFP or Ildr2. AUC: area under the curve. Insignificant differences by AUC analysis show that hepatic lipoprotein secretion is unaffected by Triton WR1339 administration in ADKD and ADOX mice.
Figure 5
Figure 5. FPLC analysis of plasma lipoprotein fractions in ADKD and ADOX WT mice.
At 7 days p.t. with either ADKD or ADOX vectors, plasma from 6 wild-type mice was collected, pooled and TCH and TG profiles were analyzed by FPLC using Sepharose 6 Fast Flow columns. HDL, high-density lipoprotein; LDL, low-density lipoprotein; VLDL, very low-density lipoprotein. (A) TCH profile in wild-type mice, 7 days p.t. with adenovirus knockdown vector expressing RNAi for lacZ or Ildr2; (B) TCH profile in wild-type mice, 7 days p.t. with adenovirus vector over-expressing GFP or Ildr2; (C) TG profile in wild-type mice, 7 days after adenovirus knockdown vector expressing RNAi for lacZ or Ildr2; (D) TG profile in wild-type mice, 7 days p.t. with adenovirus vector over-expressing GFP or Ildr2. These experiments show an increase in plasma TG (as VLDL) in ADKD mice but not in ADOX mice. TCH shifts in ADKD mice from HDL to LDL and VLDL, while in ADOX mice the decrease in HDL is accompanied by an increase in VLDL only.
Figure 6
Figure 6. Relative expression of selected genes in ADKD and ADOX WT and OB mice.
10-week-old B6 male mice were chow-fed, intravenously injected with ADKD and ADOX vectors and sacrificed at 3 days p.t, following a 12-hr fast. Expression levels were determined by qPCR normalized to expression levels of the 36B4 housekeeping gene. Fold changes are relative to the GFP control in the same state as the Ildr2 (either fasted or refed compared to fasted or refed). * indicates p<0.05; ** indicates p<0.01 (2 tailed t-test). (A) Expression in wild-type mice, 3 days p.t. with adenovirus knockdown vector expressing RNAi for lacZ or Ildr2; (B) Expression in wild-type mice, 10 days p.t. with adenovirus knockdown vector expressing RNAi for lacZ or Ildr2; (C) Expression in wild-type mice, 10 days p.t. with adenovirus vector over-expressing GFP or Ildr2; (D) Expression in wild-type mice, 3 days p.t. with adenovirus knockdown vector expressing RNAi for lacZ or Ildr2: (E) Expression in ob/ob mice, 10 days p.t. with adenovirus knockdown vector expressing RNAi for lacZ or Ildr2; (F) Expression in ob/ob mice, 10 days p.t. with adenovirus vector over-expressing GFP or Ildr2. Changes in transcriptional profiles appear to be secondary to changes in lipid content.
Figure 7
Figure 7. Relative expression of selected genes in ADKD and ADOX primary hepatocytes.
To identify short-term effects of changes in Ildr2 expression, hepatocytes from five 10-week-old B6 mice were extracted, pooled and plated into individual wells and exposed, in triplicate, for 24 hr to ADOX or ADKD viral vectors. RNA was extracted, transcribed into cDNA, and expression was determined by qPCR. (A) Expression in hepatocytes transduced with adenovirus knockdown vector expressing RNAi for lacZ or Ildr2; (B) Expression in hepatocytes transduced with adenovirus vector over-expressing GFP or Ildr2. These results recapitulate those seen the in vivo studies.
Figure 8
Figure 8. Expression of Ildr2 in liver is increased by adiposity through high-fat diet or leptin deficiency.
Expression of Ildr2 was determined by qPCR, normalized to 36B4 in mice sacrificed after either fasting for 24 hr or after fasting for 24 hr and followed by a 12-hr refeeding period. (A) Wild type B6 mice at 6 weeks of age were fed ad libitum either chow or a high fat diet (60% of kcal from fat) for 3 additional months. (B) Chow-fed wild type B6 and leptin-deficient OB mice (B6.Cg-Lepob/J) were purchased at 9 weeks and sacrificed at 10 weeks of age. Wild-type mice fed a high fat diet and genetically obese mice showed a similar (3.6 to 3.7-fold) increase in Ildr2 liver expression compared to age- matched wild-type mice (p value <.01 ) regardless of feeding status.
Figure 9
Figure 9. Respiratory Exchange Ratio (RER) in ADKD and ADOX WT and OB mice.
Mice were chow-fed, 10-week-old B6 (WT) or B6.V-Lepob/J (OB) males, at 4 to 5 days p.t. with adenovirus knockdown vectors expressing RNAi for lacZ or Ildr2 or with adenovirus vectors over- expressing GFP or Ildr2. Data shown are mean ± SEM (8 mice per group) and run in a TSE systems indirect calorimeter for 48 hr. (A) WT ADKD; (B) OB ADKD; (C) WT ADOX; (D) OB ADOX. ADKD mice show decreased RER at night, whereas ADOX mice show no differences, day or night. AUC calculations are shown in Table 9.
Figure 10
Figure 10. ipGTT in WT and OB mice 7 days p.t.
At 7 days p.t. with adenovirus knockdown vectors expressing RNAi for lacZ or Ildr2 (left) or with adenovirus vectors over-expressing GFP or Ildr2 (right), the 10-week-old chow-fed male B6 mice that were used in the 10 day experiments were injected intraperitoneally after 12 hr fast with 2g/kg glucose. The mice used in this experiment are the same mice that on which indirect calorimetry was conducted on day 5 p.t. (A) WT ADKD; (B) OB ADKD; (C) WT ADOX; (D) OB ADOX. In both ADKD and ADOX animals, IPGTT was unaffected.

References

    1. Dokmanovic-Chouinard M, Chung WK, Chevre JC, Watson E, Yonan J, et al. (2008) Positional cloning of “Lisch-Like”. a candidate modifier of susceptibility to type 2 diabetes in mice. PLoS Genet 4: e1000137. - PMC - PubMed
    1. Clee SM, Attie AD (2007) The genetic landscape of type 2 diabetes in mice. Endocr Rev 28: 48–83. - PubMed
    1. Hauge H, Patzke S, Delabie J, Aasheim HC (2004) Characterization of a novel immunoglobulin-like domain containing receptor. Biochem Biophys Res Commun 323: 970–978. - PubMed
    1. Mesli S, Javorschi S, Berard AM, Landry M, Priddle H, et al. (2004) Distribution of the lipolysis stimulated receptor in adult and embryonic murine tissues and lethality of LSR−/− embryos at 12.5 to 14.5 days of gestation. Eur J Biochem 271: 3103–3114. - PubMed
    1. Zagaria A, Anelli L, Coccaro N, Casieri P, Minervini A, et al. (2012) A new recurrent chromosomal translocation t(3;11)(q13;q14) in myelodysplastic syndromes associated with overexpression of the ILDR1 gene. Leuk Res 36: 852–856. - PubMed

Publication types

MeSH terms