. 2013 Jun 27;8(6):e67346.
doi: 10.1371/journal.pone.0067346. Print 2013.

BrainAGE in Mild Cognitive Impaired Patients: Predicting the Conversion to Alzheimer's Disease

Affiliations

BrainAGE in Mild Cognitive Impaired Patients: Predicting the Conversion to Alzheimer's Disease

Christian Gaser et al. PLoS One. .

Abstract

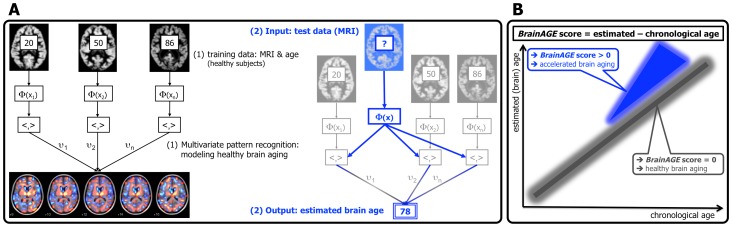
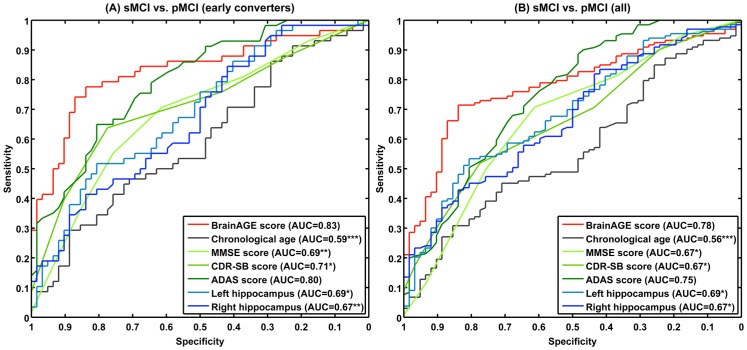
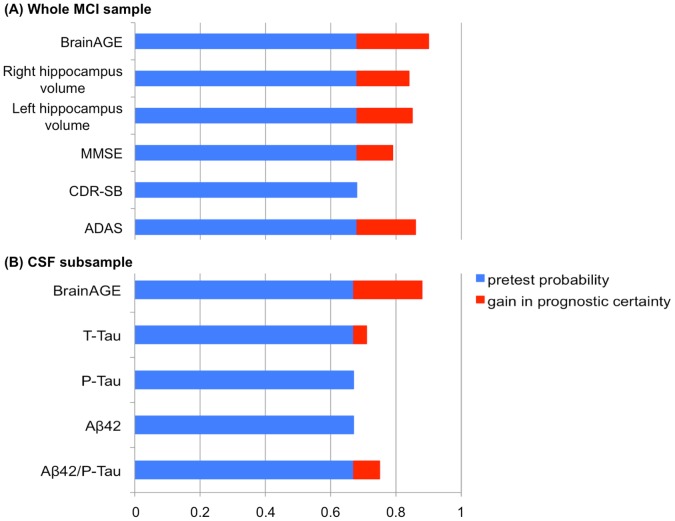
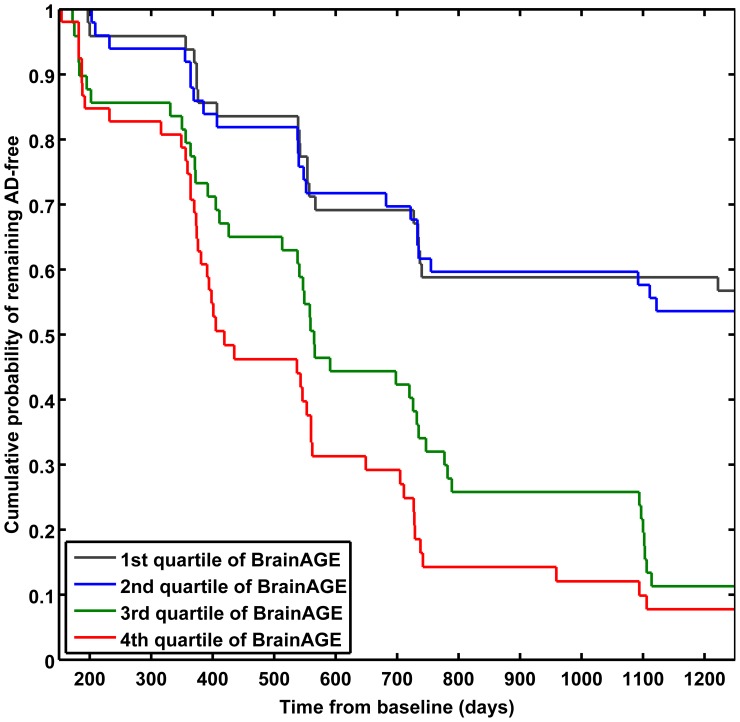
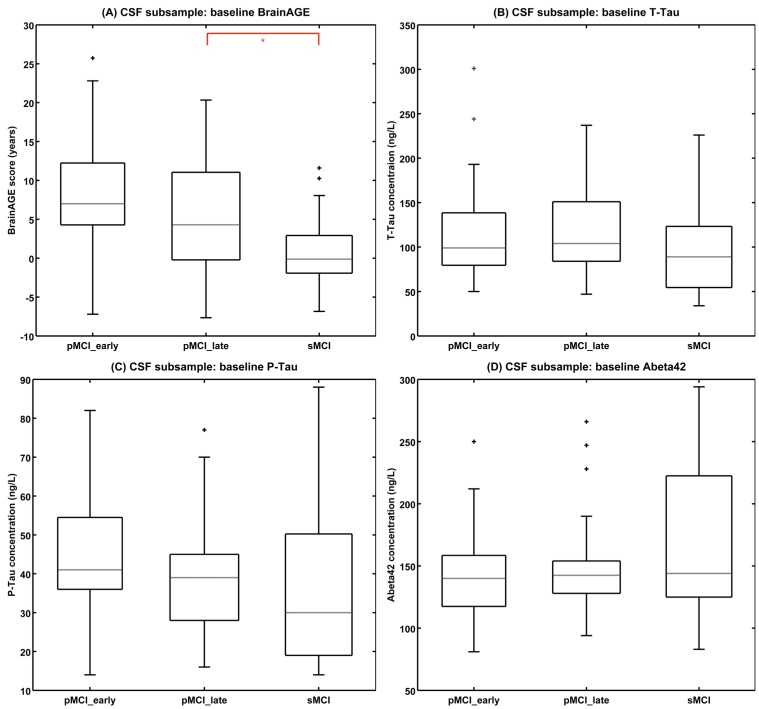
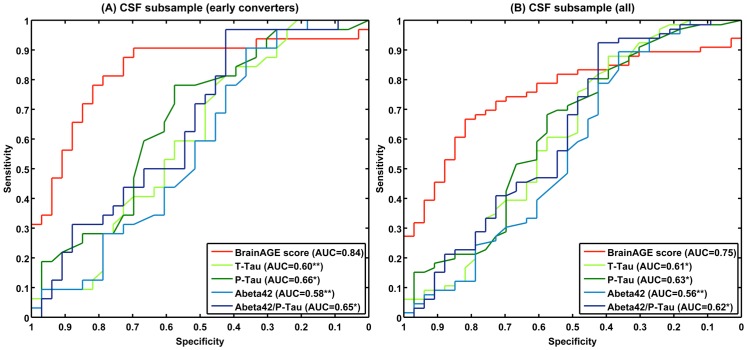
Alzheimer's disease (AD), the most common form of dementia, shares many aspects of abnormal brain aging. We present a novel magnetic resonance imaging (MRI)-based biomarker that predicts the individual progression of mild cognitive impairment (MCI) to AD on the basis of pathological brain aging patterns. By employing kernel regression methods, the expression of normal brain-aging patterns forms the basis to estimate the brain age of a given new subject. If the estimated age is higher than the chronological age, a positive brain age gap estimation (BrainAGE) score indicates accelerated atrophy and is considered a risk factor for conversion to AD. Here, the BrainAGE framework was applied to predict the individual brain ages of 195 subjects with MCI at baseline, of which a total of 133 developed AD during 36 months of follow-up (corresponding to a pre-test probability of 68%). The ability of the BrainAGE framework to correctly identify MCI-converters was compared with the performance of commonly used cognitive scales, hippocampus volume, and state-of-the-art biomarkers derived from cerebrospinal fluid (CSF). With accuracy rates of up to 81%, BrainAGE outperformed all cognitive scales and CSF biomarkers in predicting conversion of MCI to AD within 3 years of follow-up. Each additional year in the BrainAGE score was associated with a 10% greater risk of developing AD (hazard rate: 1.10 [CI: 1.07-1.13]). Furthermore, the post-test probability was increased to 90% when using baseline BrainAGE scores to predict conversion to AD. The presented framework allows an accurate prediction even with multicenter data. Its fast and fully automated nature facilitates the integration into the clinical workflow. It can be exploited as a tool for screening as well as for monitoring treatment options.


Conflict of interest statement

Competing Interests: The authors have declared that no competing interests exist.

Figures

Figure 1
Figure 1. Depiction of the BrainAGE concept.
(A) The model of healthy brain aging is trained with the chronological age and preprocessed structural MRI data of a training sample (left; with an exemplary illustration of the most important voxel locations that were used by the age regression model). Subsequently, the individual brain ages of previously unseen test subjects are estimated, based on their MRI data (blue; picture modified from Schölkopf & Smola, 2002 [35]). (B) The difference between the estimated and chronological age results in the BrainAGE score, indicating abnormal brain aging. [Image reproduced from Franke & Gaser, 2012 , with permission from Hogrefe Publishing, Bern].
Figure 2
Figure 2. Baseline scores in all MCI groups.
Shown are box plots for baseline (A) BrainAGE scores (in years), (B) MMSE scores, (C) CDR-SB scores, (D) ADAS scores, (E) left and (F) right hippocampus volumes (in mm3) of all diagnostic groups. Post-hoc t-tests resulting in significant differences between diagnostic groups are indicated (p<0.05; red lines). The boxes contain the values between the 25th and 75th percentiles, including the median (dashed line). Lines extending above and below each box symbolize data within 1.5 times the interquartile range (outliers are displayed with a +). Width of the boxes indicates the group size.
Figure 3
Figure 3. Cognitive scores during follow-up.
Mean (A) MMSE, (B) CDR-SB, (C) ADAS scores in pMCI_early, pMCI_late, and sMCI subjects at baseline examination as well as all follow-up assessments. Error bars depict the standard error of the mean (SEM).
Figure 4
Figure 4. ROC curves of individual subject classification to sMCI or pMCI.
ROC curves of individual subject classification to sMCI or pMCI based on baseline BrainAGE scores, cognitive scores, and hippocampus volumes for (A) early converters and (B) the whole sample. The areas under the ROC curves (AUCs) of cognitive scores and hippocampus volumes were tested against the AUC of BrainAGE: ***p<0.001; **p<0.01; *p<0.05.
Figure 5
Figure 5. Pre-test and post-test probability for predicting conversion to AD.
Pre-test probability (blue) and post-test probability (blue+red), indicating the gain in prognostic certainty (red) for predicting conversion to AD within 36 months, based on (A) baseline BrainAGE scores, hippocampus volume, and cognitive measures within the whole MCI sample, as well as (B) baseline BrainAGE scores and CSF biomarkers in the CSF subsample.
Figure 6
Figure 6. Cumulative probability of remaining AD-free in the quartiles of baseline BrainAGE score.
Kaplan-Meier survival curves based on Cox regression comparing cumulative AD incidence in subjects with MCI at baseline by BrainAGE score quartiles (p for trend <0.001). Duration of follow-up is truncated at 1250 days.
Figure 7
Figure 7. Baseline BrainAGE scores and baseline CSF biomarker concentrations in the MCI-subsample.
Shown are box plots for (A) BrainAGE scores, (B) T-Tau, (C) P-Tau, and (D) Aβ42 concentration at baseline of all diagnostic groups in the subsample that also provides CSF data. The boxes contain the values between the 25th and 75th percentiles, including the median (grey line). Lines extending above and below each box symbolize data within 1.5 times the interquartile range (outliers are displayed with a +). Width of the boxes indicates the group size. Post-hoc t-tests resulted in significant differences between diagnostic groups only for baseline BrainAGE scores (p<0.05; red lines).
Figure 8
Figure 8. ROC curves of individual subject classification to sMCI or pMCI in the CSF subsample.
ROC curves of individual subject classification to sMCICSF or pMCICSF based on baseline BrainAGE scores and CSF biomarkers for (A) early converters and (B) the whole CSF subsample. The areas under the ROC curves (AUCs) of the CSF biomarkers were tested against the AUC of BrainAGE: **p<0.01; *p<0.05.

References

    1. Brookmeyer R, Johnson E, Ziegler-Graham K, Arrighi HM (2007) Forecasting the global burden of Alzheimer's disease. Alzheimers Dement 3: 186–191. - PubMed
    1. Jack CR Jr, Knopman DS, Jagust WJ, Shaw LM, Aisen PS, et al. (2010) Hypothetical model of dynamic biomarkers of the Alzheimer's pathological cascade. Lancet Neurol 9: 119–128. - PMC - PubMed
    1. Cao K, Chen-Plotkin AS, Plotkin JB, Wang LS (2010) Age-correlated gene expression in normal and neurodegenerative human brain tissues. PLoS One 5: e13098. - PMC - PubMed
    1. Saetre P, Jazin E, Emilsson L (2011) Age-related changes in gene expression are accelerated in Alzheimer's disease. Synapse 65: 971–974. - PubMed
    1. Jones DT, Machulda MM, Vemuri P, McDade EM, Zeng G, et al. (2011) Age-related changes in the default mode network are more advanced in Alzheimer disease. Neurology 77: 1524–1531. - PMC - PubMed

Publication types