. 2013 Jun 24;8(6):e67454.
doi: 10.1371/journal.pone.0067454. Print 2013.

Regional differences in islet distribution in the human pancreas--preferential beta-cell loss in the head region in patients with type 2 diabetes

Affiliations

Regional differences in islet distribution in the human pancreas--preferential beta-cell loss in the head region in patients with type 2 diabetes

Xiaojun Wang et al. PLoS One. .

Abstract

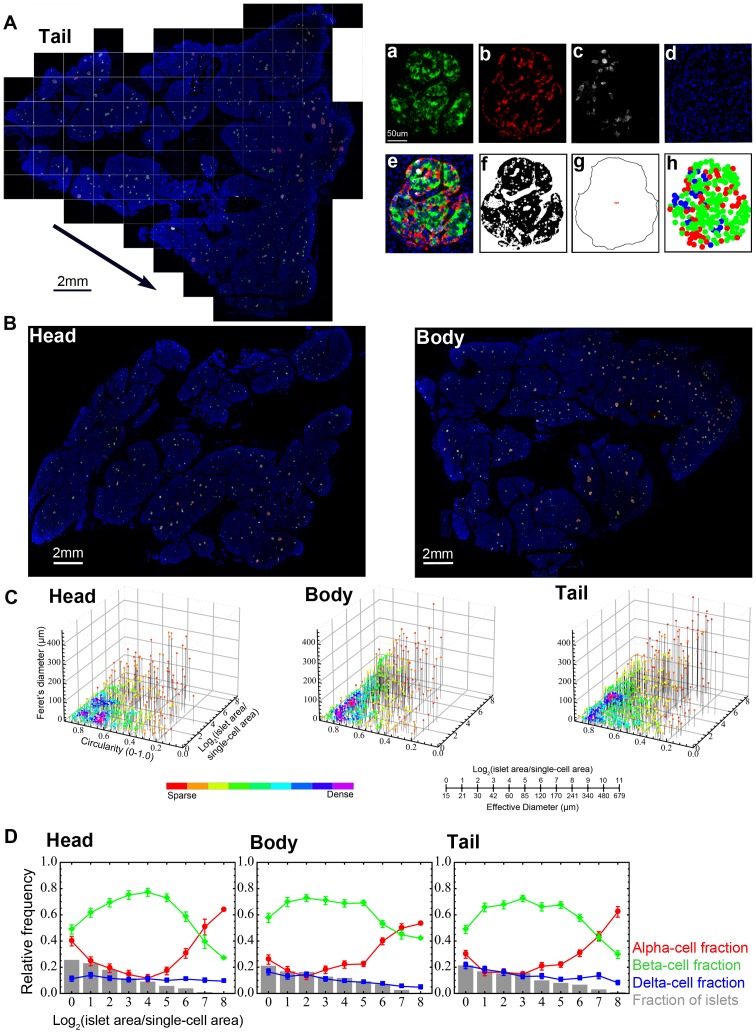
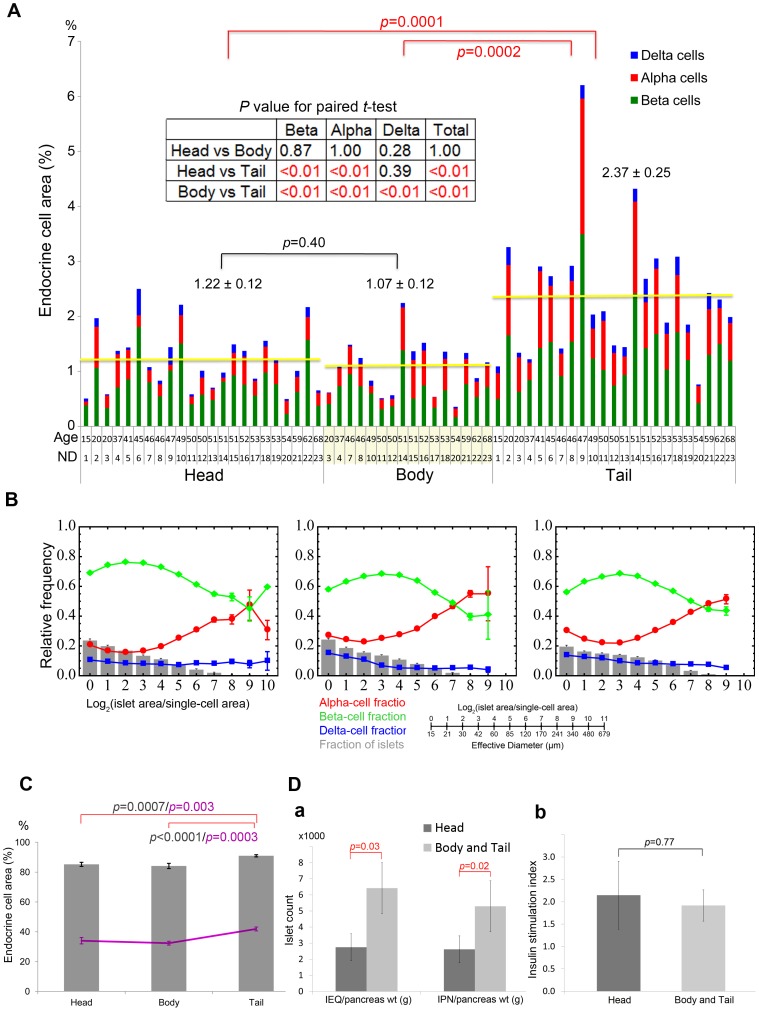
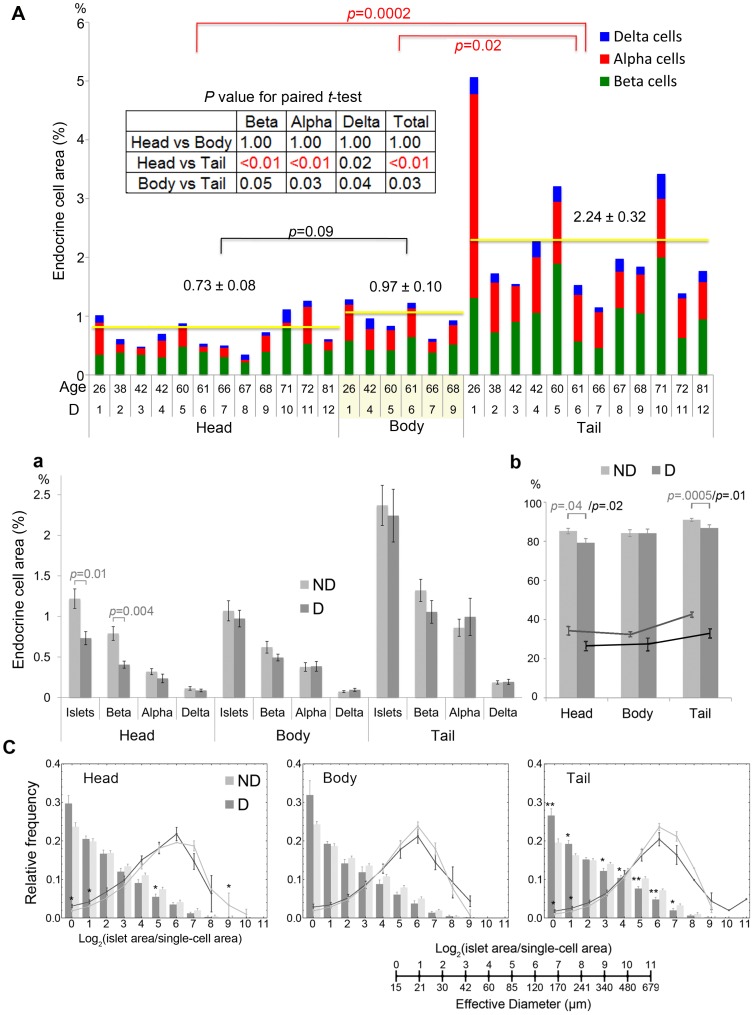
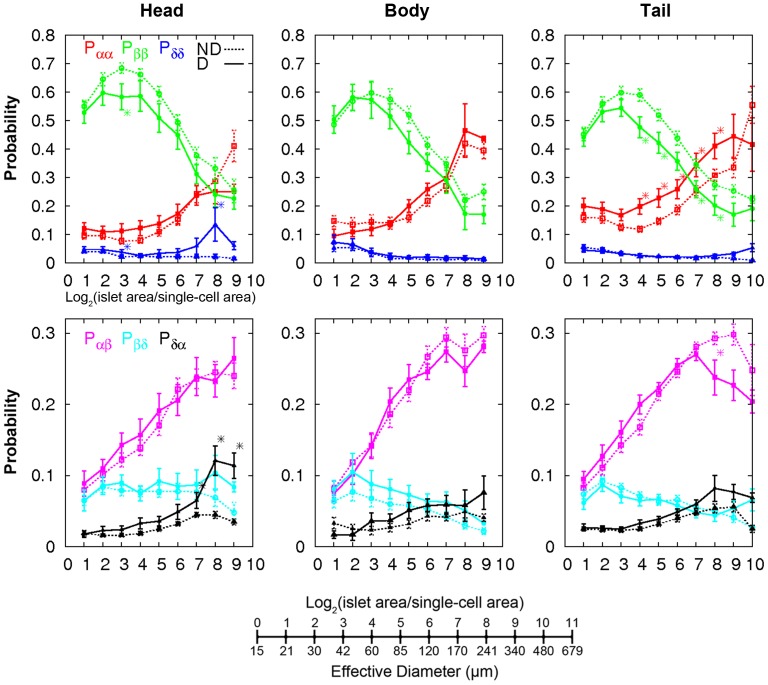
While regional heterogeneity in islet distribution has been well studied in rodents, less is known about human pancreatic histology. To fill gaps in our understanding, regional differences in the adult human pancreas were quantitatively analyzed including the pathogenesis of type 2 diabetes (T2D). Cadaveric pancreas specimens were collected from the head, body and tail regions of each donor, including subjects with no history of diabetes or pancreatic diseases (n = 23) as well as patients with T2D (n = 12). The study further included individuals from whom islets were isolated (n = 7) to study islet yield and function in a clinical setting of islet transplantation. The whole pancreatic sections were examined using an innovative large-scale image capture and unbiased detailed quantitative analyses of the characteristics of islets from each individual (architecture, size, shape and distribution). Islet distribution/density is similar between the head and body regions, but is >2-fold higher in the tail region. In contrast to rodents, islet cellular composition and architecture were similar throughout the pancreas and there was no difference in glucose-stimulated insulin secretion in islets isolated from different regions of the pancreas. Further studies revealed preferential loss of large islets in the head region in patients with T2D. The present study has demonstrated distinct characteristics of the human pancreas, which should provide a baseline for the future studies integrating existing research in the field and helping to advance bi-directional research between humans and preclinical models.


Conflict of interest statement

Competing Interests: The authors have declared that no competing interests exist.

Figures

Figure 1
Figure 1. Large-scale image capture and computer-assisted semi-automated analysis of the whole tissue section.
A: Virtual slice view of a human pancreatic section (tail region; ND21: 59-yr old male) immunostained for insulin (green), glucagon (red), somatostatin (white) and nuclei (blue). A series of contiguous images of a specimen is collected (illustrated as boxed panels) and merged into a single image montage (i.e. virtual slice; arrowed). A composite is made by merging four overlapping virtual slice images. Regional views of each channel are shown on the right. a. beta-cells, b. alpha-cells, c. delta-cells, and d. nuclei. e. A composite of all three endocrine cells and nuclei. Note that there is no overlap among the endocrine cell fractions. f. Total endocrine cell area shown as a converted 8-bit mask after automatic thresholding. g. Total islet area that includes unstained fractions such as intraislet capillary. h. Reconstructed endocrine cell distribution within each islet based on the captured center coordinates of each cell type within the given islet, which can be used to count the number of each endocrine cell type and analyze cellular composition and geographic islet architecture. B: Virtual slice views of the head and body region. C: Three-dimensional visualization of islet size (area) and shape (circularity and Feret's diameter) distribution in the head, body and tail region. Each dot represents a single islet/cluster. The density of islets is color-coded from sparse to dense. The conversion between logarithmic islet area and effective diameter (µm) is shown. D: Quantitative analysis of individual islet size distribution and cellular composition. Relative frequency of islet size (gray bar) and ratios of beta (green), alpha (red), and delta (blue) cells within islets are plotted against islet size; means ±SEM.
Figure 2
Figure 2. Regional differences in islet distribution and cellular compositions in human pancreas.
A: Inter-specimen comparison of endocrine cell mass in the head, body and tail region. Total islet cell composition (beta-cells in green, alpha-cells in red, and delta-cells in blue) in individuals with no history of diabetes. Student's t-test compared the results between each region (with red and black bars). The regional differences were further confirmed in each individual by paired t-test (inset). B: Relative frequency of islet size (gray bar) and ratios of alpha (red), beta (green), and delta (blue) cells within islets are plotted against islet size; means ±SEM. C: The percent of large islets (>50 µm in diameter) in the total number of islets/clusters (line) and in the total area (bar). D: a. Regional differences of the yield of isolated islets (>∼50 µm in diameter; n = 7). IEQ: islet equivalent number and IPN: islet particulate number. b. Insulin secretory response measured as stimulation index.
Figure 3
Figure 3. Regional changes of islet distribution and cellular compositions in patients with T2D.
A: Inter-specimen comparison of endocrine cell mass in the head, body and tail region. Total islet cell composition (beta-cells in green, alpha-cells in red, and delta-cells in blue) in patients with T2D is shown. Student's t-test compared the results between each region (with red and black bars). B: a. Comparison between non-diabetic subjects (ND) and patients with T2D (D) in the total mass of islets and each endocrine cells (in gray and black bars, respectively). b. The percent of large islets (>50 µm in diameter) in the total number of islets/clusters (lines; ND in gray and D in black) and in the total area (bars; ND in gray and D in black). C: Changes in islet size distribution (bar) and contribution of each islet size bin to the total islet area (line) in patients with T2D (in black) compared to non-diabetic subjects (in gray).
Figure 4
Figure 4. Changes of islet architectures in patients with T2D.
Cell-cell contact probabilities calculated using fractions of specific contacts between neighboring cell types (e.g. Pαβ quantified the fraction of alpha- and beta-cell contacts among every neighboring cell contact). Non-diabetic (ND, dotted line) and Diabetic (D, solid line). Mean ±SEM. *P<0.05 from student's t-test between ND and D.

References

    1. Brissova M, Fowler MJ, Nicholson WE, Chu A, Hirshberg B, et al. (2005) Assessment of human pancreatic islet architecture and composition by laser scanning confocal microscopy. J Histochem Cytochem 53: 1087–1097. - PubMed
    1. Cabrera O, Berman DM, Kenyon NS, Ricordi C, Berggren PO, et al. (2006) The unique cytoarchitecture of human pancreatic islets has implications for islet cell function. Proc Natl Acad Sci U S A 103: 2334–2339. - PMC - PubMed
    1. Kharouta M, Miller K, Kim A, Wojcik P, Kilimnik G, et al. (2009) No mantle formation in rodent islet – the prototype of islet revisited. Diabetes Res Clin Pract 85: 252–257. - PMC - PubMed
    1. Kim A, Miller K, Jo J, Kilimnik G, Wojcik P, et al. (2009) Islet architecture – a comparative study. Islets 1: 129–136. - PMC - PubMed
    1. Kilimnik G, Zhao B, Jo J, Periwal V, Witkowski P, et al. (2011) Altered islet composition and disproportionate loss of large islets in patients with type 2 diabetes. PLoS One 6: e27445. - PMC - PubMed

Publication types