

FlowMax: A Computational Tool for Maximum Likelihood Deconvolution of CFSE Time Courses
- PMID: 23826329
- PMCID: PMC3694893
- DOI: 10.1371/journal.pone.0067620
FlowMax: A Computational Tool for Maximum Likelihood Deconvolution of CFSE Time Courses
Abstract
The immune response is a concerted dynamic multi-cellular process. Upon infection, the dynamics of lymphocyte populations are an aggregate of molecular processes that determine the activation, division, and longevity of individual cells. The timing of these single-cell processes is remarkably widely distributed with some cells undergoing their third division while others undergo their first. High cell-to-cell variability and technical noise pose challenges for interpreting popular dye-dilution experiments objectively. It remains an unresolved challenge to avoid under- or over-interpretation of such data when phenotyping gene-targeted mouse models or patient samples. Here we develop and characterize a computational methodology to parameterize a cell population model in the context of noisy dye-dilution data. To enable objective interpretation of model fits, our method estimates fit sensitivity and redundancy by stochastically sampling the solution landscape, calculating parameter sensitivities, and clustering to determine the maximum-likelihood solution ranges. Our methodology accounts for both technical and biological variability by using a cell fluorescence model as an adaptor during population model fitting, resulting in improved fit accuracy without the need for ad hoc objective functions. We have incorporated our methodology into an integrated phenotyping tool, FlowMax, and used it to analyze B cells from two NFκB knockout mice with distinct phenotypes; we not only confirm previously published findings at a fraction of the expended effort and cost, but reveal a novel phenotype of nfkb1/p105/50 in limiting the proliferative capacity of B cells following B-cell receptor stimulation. In addition to complementing experimental work, FlowMax is suitable for high throughput analysis of dye dilution studies within clinical and pharmacological screens with objective and quantitative conclusions.
Conflict of interest statement
Figures


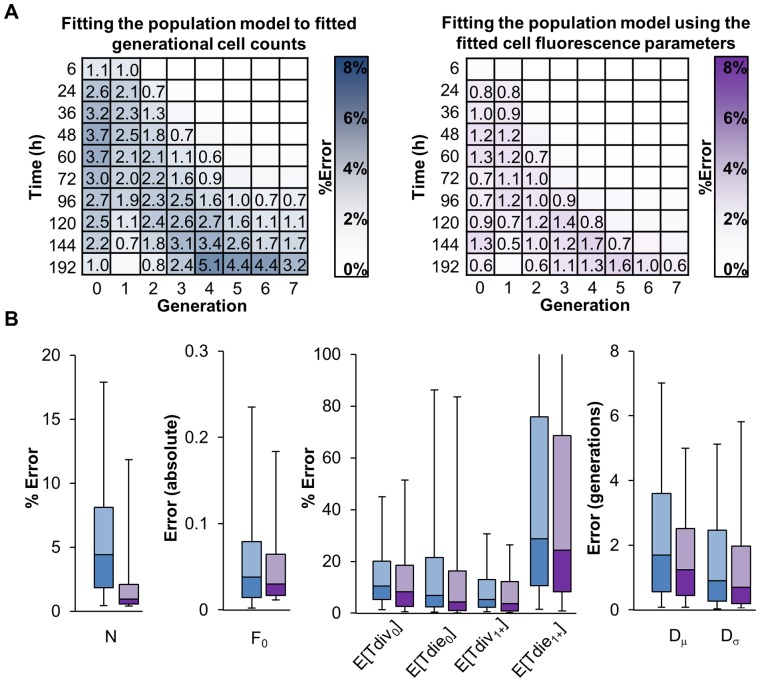
 , parameterized according to equations describing variability in staining (CV), background fluorescence (b), dye dilution (r), and a small correction for the fluorescence of the initial population of cells (s). Weights for each Gaussian correspond to cell counts in each generation. (B) Analysis of the cell fluorescence model fitting accuracy for 1,000 generated CFSE fluorescence time courses (see also Tables S3 and S4). Average percent error in generational cell counts normalized to the maximum generational cell count for each time course. Numbers indicate an error ≥ 0.5%. (C) Representative cell fluorescence model fitting to experimental data from wildtype B cells at indicated time points after start of lipopolysaccharides (LPS) stimulation (red lines indicate undivided population).


References
-
- Murphy K, Travers P, Walport M (2007) Janeway’s Immunobiology (Immunobiology: The Immune System (Janeway)): Garland Science.
-
- Subramanian VG, Duffy KR, Turner ML, Hodgkin PD (2008) Determining the expected variability of immune responses using the cyton model. J Math Biol 56: 861–892. - PubMed
-
- Weston SA, Parish CR (1990) New fluorescent dyes for lymphocyte migration studies. Analysis by flow cytometry and fluorescence microscopy. J Immunol Methods 133: 87–97. - PubMed
Publication types
MeSH terms
Substances
Grants and funding
LinkOut - more resources
Full Text Sources
Other Literature Sources
Miscellaneous
