

Exogenous glucose administration impairs glucose tolerance and pancreatic insulin secretion during acute sepsis in non-diabetic mice
- PMID: 23826335
- PMCID: PMC3691245
- DOI: 10.1371/journal.pone.0067716
Exogenous glucose administration impairs glucose tolerance and pancreatic insulin secretion during acute sepsis in non-diabetic mice
Abstract
Objectives: The development of hyperglycemia and the use of early parenteral feeding are associated with poor outcomes in critically ill patients. We therefore examined the impact of exogenous glucose administration on the integrated metabolic function of endotoxemic mice using our recently developed frequently sampled intravenous glucose tolerance test (FSIVGTT). We next extended our findings using a cecal ligation and puncture (CLP) sepsis model administered early parenteral glucose support.
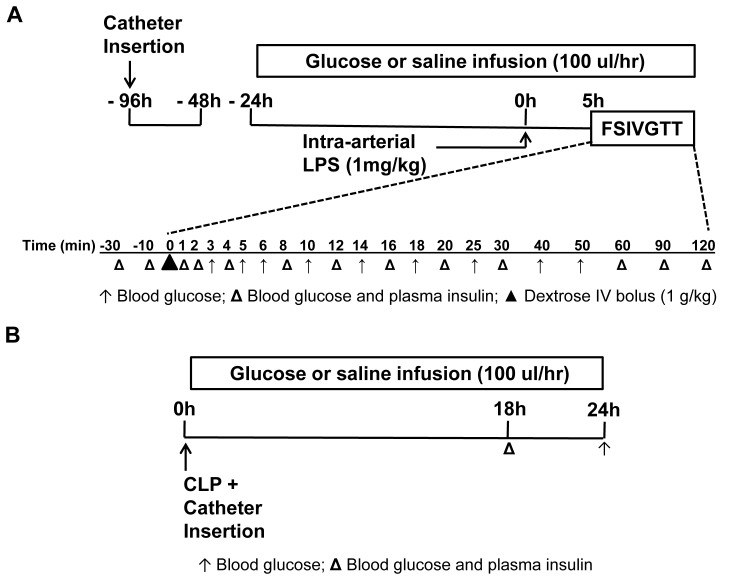
Methods: Male C57BL/6J mice, 8-12 weeks, were instrumented with chronic indwelling arterial and venous catheters. Endotoxemia was initiated with intra-arterial lipopolysaccharide (LPS; 1 mg/kg) in the presence of saline or glucose infusion (100 µL/hr), and an FSIVGTT was performed after five hours. In a second experiment, catheterized mice underwent CLP and the impact of early parenteral glucose administration on glucose homeostasis and mortality was assessed over 24 hrs.
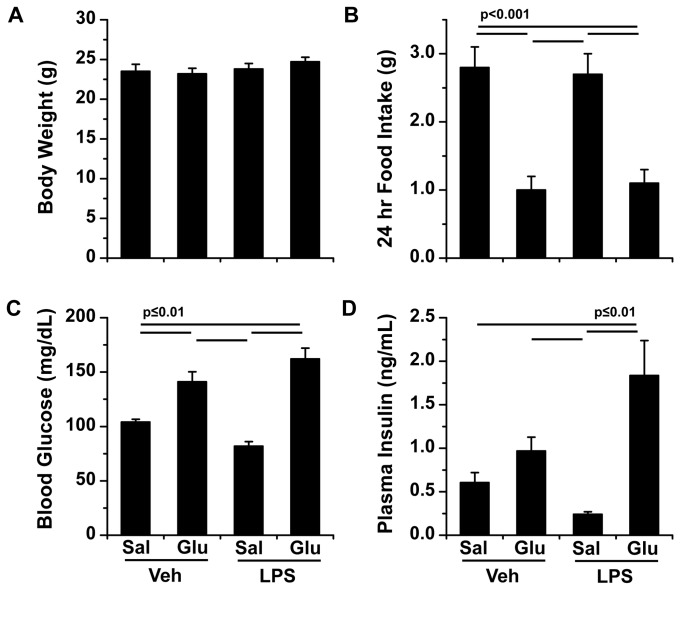
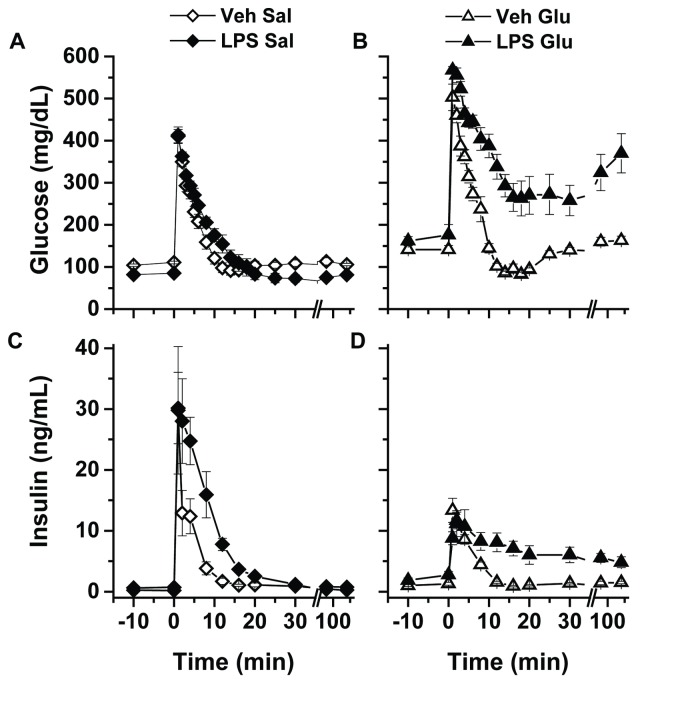
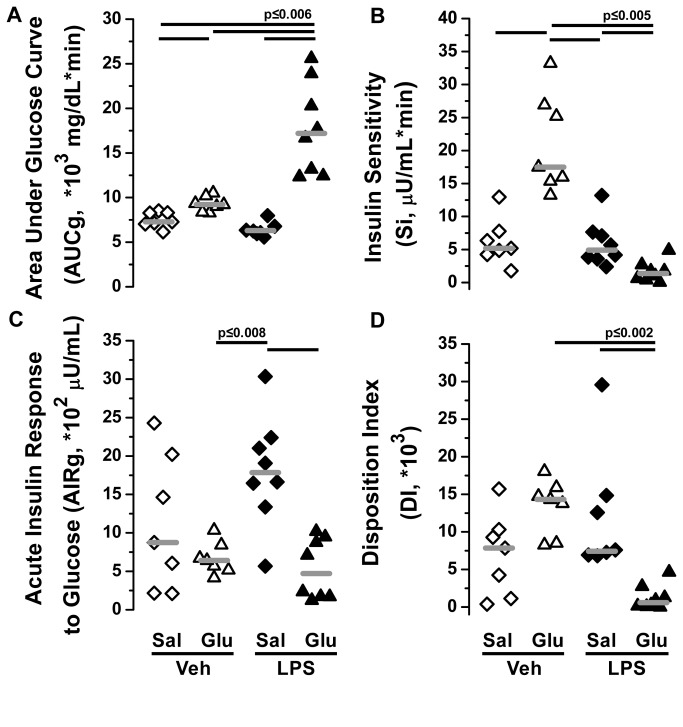
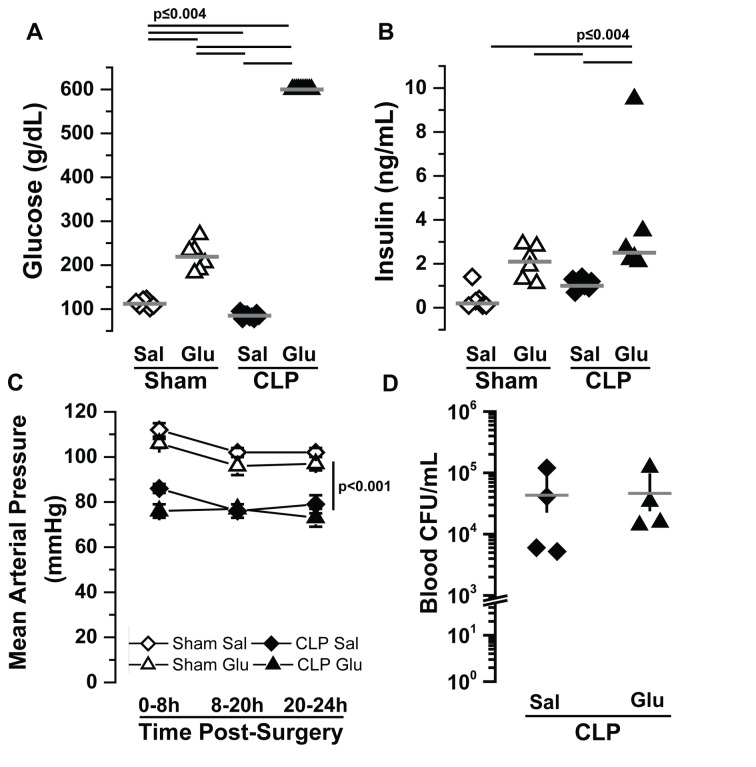
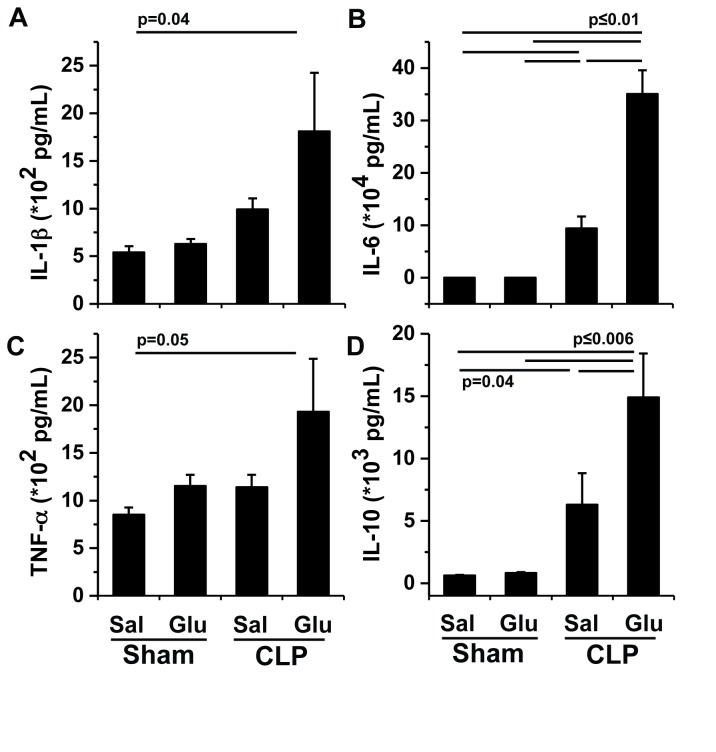
Measurements: AND MAIN RESULTS: Administration of LPS alone did not impair metabolic function, whereas glucose administration alone induced an insulin sensitive state. In contrast, LPS and glucose combined caused marked glucose intolerance and insulin resistance and significantly impaired pancreatic insulin secretion. Similarly, CLP mice receiving parenteral glucose developed fulminant hyperglycemia within 18 hrs (all > 600 mg/dl) associated with increased systemic cytokine release and 40% mortality, whereas CLP alone (85 ± 2 mg/dL) or sham mice receiving parenteral glucose (113 ± 3 mg/dL) all survived and were not hyperglycemic. Despite profound hyperglycemia, plasma insulin in the CLP glucose-infused mice (3.7 ± 1.2 ng/ml) was not higher than sham glucose infused mice (2.1 ± 0.3 ng/ml).
Conclusions: The combination of parenteral glucose support and the systemic inflammatory response in the acute phase of sepsis induces profound insulin resistance and impairs compensatory pancreatic insulin secretion, leading to the development of fulminant hyperglycemia.
Conflict of interest statement
Figures
Similar articles
-
Early initiation of low-level parenteral dextrose induces an accelerated diabetic phenotype in septic C57BL/6J mice.Appl Physiol Nutr Metab. 2016 Jan;41(1):12-9. doi: 10.1139/apnm-2015-0213. Epub 2015 Sep 9. Appl Physiol Nutr Metab. 2016. PMID: 26624964 Free PMC article.
-
Hyperinsulinemia predicts survival in a hyperglycemic mouse model of critical illness.Crit Care Med. 2009 Sep;37(9):2596-603. doi: 10.1097/CCM.0b013e3181a9338a. Crit Care Med. 2009. PMID: 19623043 Free PMC article.
-
The manner of the inflammation-boosting effect caused by acute hyperglycemia secondary to overfeeding and the effects of insulin therapy in a rat model of sepsis.J Surg Res. 2013 Nov;185(1):380-7. doi: 10.1016/j.jss.2013.05.110. Epub 2013 Jun 27. J Surg Res. 2013. PMID: 23932353
-
Stress hyperglycemia, cardiac glucotoxicity, and critically ill patient outcomes current clinical and pathophysiological evidence.Physiol Rep. 2021 Jan;9(2):e14713. doi: 10.14814/phy2.14713. Physiol Rep. 2021. PMID: 33463901 Free PMC article. Review.
-
Management of Hyperglycemia in Hospitalized Patients Receiving Parenteral Nutrition.Front Clin Diabetes Healthc. 2022 Feb 21;3:829412. doi: 10.3389/fcdhc.2022.829412. eCollection 2022. Front Clin Diabetes Healthc. 2022. PMID: 36992742 Free PMC article. Review.
Cited by
-
Effects of glycemic control on glucose utilization and mitochondrial respiration during resuscitated murine septic shock.Intensive Care Med Exp. 2014 Dec;2(1):19. doi: 10.1186/2197-425X-2-19. Epub 2014 Jun 3. Intensive Care Med Exp. 2014. PMID: 26266919 Free PMC article.
-
Cellular and Exosomal Regulations of Sepsis-Induced Metabolic Alterations.Int J Mol Sci. 2021 Aug 2;22(15):8295. doi: 10.3390/ijms22158295. Int J Mol Sci. 2021. PMID: 34361061 Free PMC article. Review.
-
Early initiation of low-level parenteral dextrose induces an accelerated diabetic phenotype in septic C57BL/6J mice.Appl Physiol Nutr Metab. 2016 Jan;41(1):12-9. doi: 10.1139/apnm-2015-0213. Epub 2015 Sep 9. Appl Physiol Nutr Metab. 2016. PMID: 26624964 Free PMC article.
-
Glucose supply and glycolysis inhibition shape the clinical fate of Staphylococcus epidermidis-infected preterm newborns.JCI Insight. 2022 Jun 8;7(11):e157234. doi: 10.1172/jci.insight.157234. JCI Insight. 2022. PMID: 35503431 Free PMC article.
-
Pancreatic Islet Responses to Metabolic Trauma.Shock. 2016 Sep;46(3):230-8. doi: 10.1097/SHK.0000000000000607. Shock. 2016. PMID: 26974425 Free PMC article. Review.
References
Publication types
MeSH terms
Substances
LinkOut - more resources
Full Text Sources
Other Literature Sources
Medical
Miscellaneous
