. 2014 Jan 15;85 Pt 2(0 2):834-43.
doi: 10.1016/j.neuroimage.2013.06.067. Epub 2013 Jul 1.

Human intracranial high-frequency activity maps episodic memory formation in space and time

Affiliations

Human intracranial high-frequency activity maps episodic memory formation in space and time

John F Burke et al. Neuroimage. .

Abstract

Noninvasive neuroimaging studies have revealed a network of brain regions that activate during human memory encoding; however, the relative timing of such activations remains unknown. Here we used intracranially recorded high-frequency activity (HFA) to first identify regions that activate during successful encoding. Then, we leveraged the high-temporal precision of HFA to investigate the timing of such activations. We found that memory encoding invokes two spatiotemporally distinct activations: early increases in HFA that involve the ventral visual pathway as well as the medial temporal lobe and late increases in HFA that involve the left inferior frontal gyrus, left posterior parietal cortex, and left ventrolateral temporal cortex. We speculate that these activations reflect higher-order visual processing and top-down modulation of attention/semantic information, respectively.

Keywords: Electrocorticography; Functional mapping; Gamma; HFA; High-frequency activity; IFG; Inferior frontal gyrus; LFA; Low-frequency activity; Memory; PPC; Posterior parietal cortex; SM; Subsequent memory; VLTC; Ventrolateral temporal cortex.


Figures

Figure 1
Figure 1
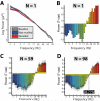
Power changes during encoding (0-2000 ms post word presentation). A: For a single electrode in the left temporal cortex, averaged raw power (y-axis) during the presentation of items that were later recalled (Rec; successful encoding; red line), not-recalled (NRec; unsuccessful encoding; blue line), and all baseline events (gray line) are plotted for all wavelet frequencies (x-axis). Errorbars represent 95% CI across items or baseline events. B: For the same data in (A), t-statistics (y-axis) comparing successfully and unsuccessfully encoded events are shown for all wavelet frequencies (x-axis). C,D: Averaged t-statistics across patients are shown for electrodes (C) in the left temporal cortex and (D) all electrodes. Errorbars reflect ±1 SEM across patients. Yellow asterisks mark significant increases/decreases in power during encoding (t-test; p < 0.05; Bonferroni corrected). In panel (D), 28.7 Hz refers to the mid-way point between adjacent frequency bins on the x-axis.
Figure 2
Figure 2
Power changes during encoding (0-2000 ms post word presentation). All spherical regions that exhibited a significant (permutation procedure; FDR corrected) change in power during successful memory encoding are displayed on a standardized three-dimensional brain. Increases (Rec > NRec) and decreases (Rec < NRec) in power during encoding are shown in red and blue, respectively. The horizontal dashed line on the sagittal views corresponds to the level of the axial cut in the third panel. Color and grayscale renderings represent the percentage of nearby regions exhibiting significant effects and containing more than 5 patients, respectively. Radiological slice view is shown with right (R) and left (L) hemispheres labeled.
Figure 3
Figure 3
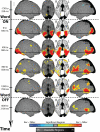
Power changes during encoding for multiple time windows. For six selected time windows, anatomical regions exhibiting a significant change in HFA during the presentation of all subsequently recalled (Rec) and not-recalled (NRec) items are displayed on a standardized three-dimensional brain. Increases (Rec > NRec) and decreases (Rec < NRec) in power during encoding are shown in red and blue, respectively. Radiological slice view is shown with right (R) and left (L) hemispheres labeled. Brain plots rendered identically as in Figure 2.
Figure 4
Figure 4
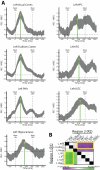
Timing comparisons of HFA between regions-of-interest (ROIs). A: In each panel, the difference in HFA across time during the presentations of recalled (REC) vs. not recalled (NREC) words is shown for each ROI. Width of lines represent ±1 SEM across patients. Green line represents time of maximum activation. Panels are arranged top-to-bottom, left-to-right by time of peak activation. B: t-statistics comparing differences in peak activation times between all 21 ROI-ROI pairs are colored-coded and displayed in each cell of the matrix. Positive t-statistics (green) indicated that the region on the corresponding y-axis (R1) activated later than the region on the corresponding x-axis (R2). Negative t-statistics (purple) indicated the R1 region activated before the R2 region. Multiple comparisons were corrected using a permutation procedure. Significant pairs (p < 0.05) are located inside of the yellow boxes. PHA: para-hippocampal area. PPC: posterior parietal lobe. IFG: Inferior frontal gyrus. VLTC: ventrolateral temporal cortex.
Figure 5
Figure 5
Regions clustered by temporal activation profile. A: All regions showing a significant change in HFA were clustered into two categories, using a k-means algorithm, which yielded an early (left panel; average temporal profile peaked at 490 ms) and a late (right panel; average temporal profile peaked at 1110 ms) cluster. B: Regions in each cluster were re-projected back onto the standard brain. Colors represent regions belonging to the early (purple) and late (green) clusters. Brain plots rendered identically as in Figures 2 and 3.

References

    1. Adcock R, Thangavel A, Whitfield-Gabrieli S, Knutson B, Gabrieli JDE. Reward-motivated learning: Mesolimbic activation precedes memory formation. Neuron. 2006;50(3):507–517. - PubMed
    1. Addante RJ, Watrous AJ, Yonelinas AP, Ekstrom AD, Ranganath C. Prestimulus theta activity predicts correct source memory retrieval. Proc Natl Acad Sci U S A. 2011;108(26) - PMC - PubMed
    1. Addison PS. The illustrated wavelet transform handbook: Introductory theory and applications in science, engineering, medicine and finance. Institute of Physics Publishing; Bristol: 2002.
    1. Badre D, Wagner A. Left ventrolateral prefrontal cortex and the cognitive control of memory. Neuropsychologia. 2007;45(13):2883–2901. - PubMed
    1. Blumenfeld R, Parks CM, Yonelinas AP, Ranganath C. Putting the pieces together: the role of dorsolateral prefrontal cortex in relational memory encoding. Journal of Cognitive Neuroscience. 2011;23(1):257–265. - PMC - PubMed

Publication types