. 2013 Jul 3;154(1):118-33.
doi: 10.1016/j.cell.2013.05.059.

Second cistron in CACNA1A gene encodes a transcription factor mediating cerebellar development and SCA6

Affiliations

Second cistron in CACNA1A gene encodes a transcription factor mediating cerebellar development and SCA6

Xiaofei Du et al. Cell. .

Abstract

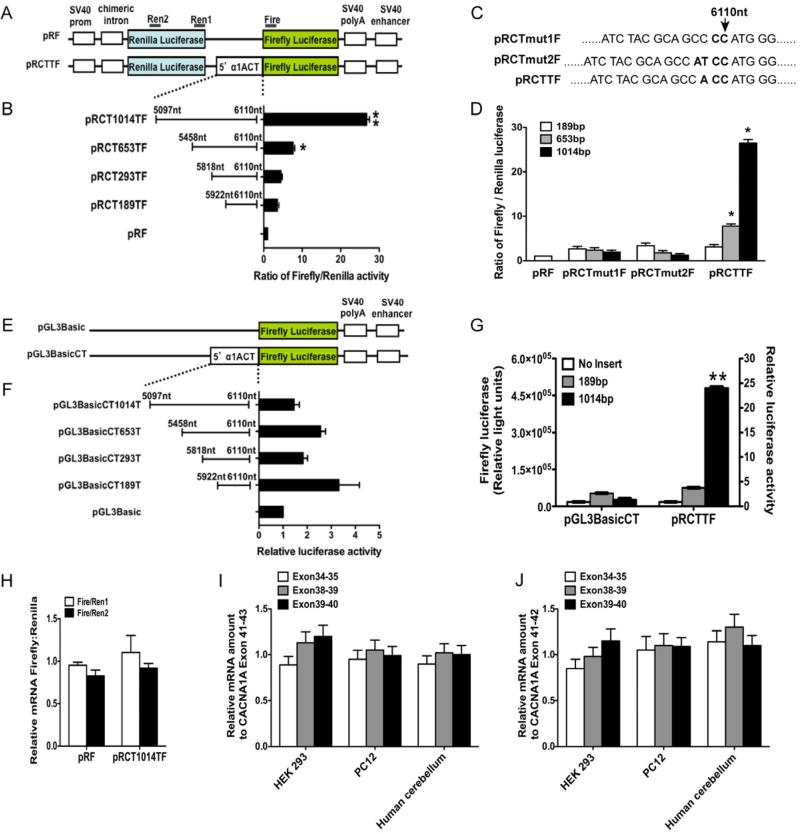
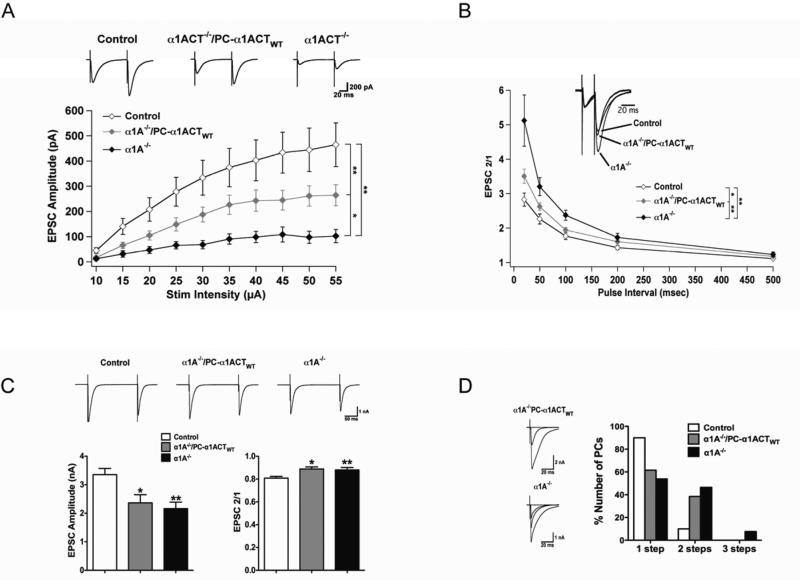
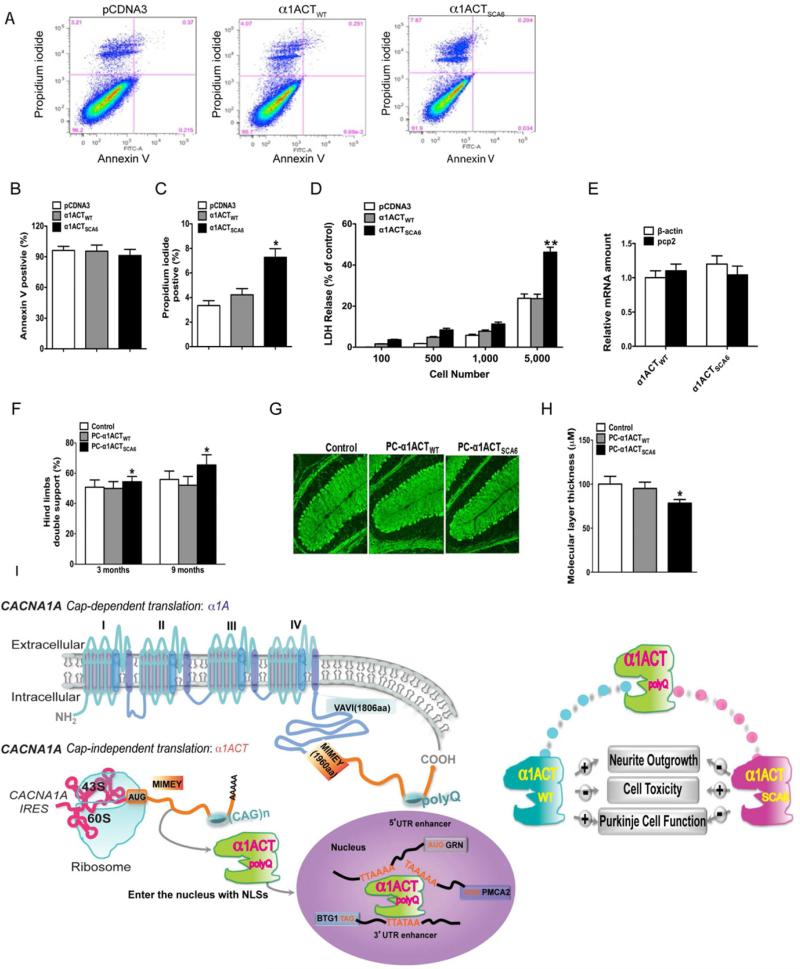
The CACNA1A gene, encoding the voltage-gated calcium channel subunit α1A, is involved in pre- and postsynaptic Ca(2+) signaling, gene expression, and several genetic neurological disorders. We found that CACNA1A coordinates gene expression using a bicistronic mRNA bearing a cryptic internal ribosomal entry site (IRES). The first cistron encodes the well-characterized α1A subunit. The second expresses a transcription factor, α1ACT, which coordinates expression of a program of genes involved in neural and Purkinje cell development. α1ACT also contains the polyglutamine (polyQ) tract that, when expanded, causes spinocerebellar ataxia type 6 (SCA6). When expressed as an independent polypeptide, α1ACT-bearing an expanded polyQ tract-lacks transcription factor function and neurite outgrowth properties, causes cell death in culture, and leads to ataxia and cerebellar atrophy in transgenic mice. Suppression of CACNA1A IRES function in SCA6 may be a potential therapeutic strategy.


Figures

Figure 1
Figure 1. The C terminal fragment of α1A subunit initiates at MIMEY (amino acids 1960-1964, nucleotide 6114-6128)
(A) Western blot analysis of fractions collected from HiTrap™ DEAE FF anion exchange chromatography. 3xFLAG-tagged α1A subunit is used as positive control. (B) Coomassie blue staining of the peak α1ACT-containing fraction after two-step purification. The arrowhead indicates the 75 kD band identified by mass spectrometry as α1ACT. (C) Western blot analysis of lysate from α1A overexpressing cells with anti-FLAG antibody confirms the identity of α1ACT. (D) LC-MS/MS analysis of in-gel digest of proprionylated protein reveals that the starting amino acid sequence of N terminus of the α1ACT fragment is Met Ile Met Glu Tyr. (E) Schematic representation of the constructs with a series of mutations or deletions. (F) In-frame deletion of the start site of α1ACT does not abolish the expression of the 75kD C terminal portion of the FLAG-tagged α1A protein bearing either normal range (Q11) or pathological range (Q33) of polyQ. (G) Expression of the 75kD α1ACT C terminal fragment persists after insertion of termination codons at T1937 or P1847 in the FLAG-tagged α1A subunit, upstream of the start site. (H) Deletion of a 534bp fragment (α1Adel534Q11), but not deletion of a 185bp fragment (α1Adel185Q11) from the α1A coding region upstream of the α1ACT eliminates α1ACT expression, while maintaining expression of full-length α1A-FLAG. Deletions using encoded Q33 repeat expansions constructs (α1Adel185Q33 and α1Adel534Q33) behave similar to the Q11 constructs (see also Figure S1).
Figure 2
Figure 2. CACNA1A mRNA contains an IRES
(A) Schematic representation of the constructs pRF and pRCTTF. (B) IRES activity is demonstrated using bicistronic vectors. The ratio of Renilla luciferase and firefly luciferase activities was determined and normalized to β-galactosidase activities. (C) Sequence of CACNA1A IRES nucleotide inserts CTT, CTmut1 and CTmut2, inserting of 1-2 nucleotides. (D) The luciferase activities of bicistronic vectors bearing nucleotide insertions are determined as in (B). (E) Schematic representation of the constructs pGL3Basic and pGL3BasicCT. The same DNA fragments as inserted into pRF were subcloned into the promoter-less pGL3Basic construct. (F) Luciferase activities are determined as in (B). (G) The raw firefly luciferase activities of two fragments are compared between promoter-less vector pGL3BasicCT and bicistronic vector pRCTTF, which suggests 1014bp fragment contains an IRES. (H) Quantitative, real-time reverse transcription-PCR (qRT-PCR) performed using RNA from cells transfected with bicistronic vectors as amplified using primers, Ren1, Ren2 and Fire demonstrates no difference in abundance of R-Luc and F-Luc mRNA. (I and J) qRT-PCR performed using RNA extracted from PC12 and HEK293 cells, transfected with α1A or human cerebellum to compare abundance of amplicons Ex34-35, Ex38-39 and Ex39-40, upstream of the α1ACT start site relative to amplicons Ex41-42 (I) and Ex41-43 (J), from within the α1ACT coding region. Data are mean ± SEM, n ≥ 3 (each involving triplicate assays, *p<0.05, **p<0.01). (see also Figure S2).
Figure 3
Figure 3. α1ACT is a transcription factor that regulates neural gene expression through an AT-rich element
(A) ChIP and quantitative real-time PCR verification of DNA sequences identified by ChIP-cloning. PC12 cells were transfected with empty vector or FLAG-tagged α1ACTWT. (B) Relative enrichment was calculated as the ratio between the net intensity of each bound sample normalized to its input sample, and the vehicle control sample normalized to vehicle control input sample (n ≥ 3). (C) Enhancer activity of BTG1 gene fragments. Positions of the fragments are indicated. (D) Promoter activity of GRN gene fragments. Positions of the fragments are indicated. (E) Consensus sequence analyzed by CLC main workbench Version 6.5 among the α1ACT ChIP-targeted sequences. Consensus sequence was predicted and labeled in red. (F) EMSA demonstrates the formation of displaceable nucleoprotein complex with the α1ACT and BTG1 WT (517-630nt) element. Lane 1 is biotin-labeled BTG1 WT probe. Lanes 2 and 5 show the three major complexes formed between BTG1 probe and α1ACTWT nuclear protein. Lane 8 shows the fourth complex formed between BTG1 probe and α1ACTSCA6 nuclear protein. (G) EMSA shows that the AT-rich probe (531-553nt) forms three complexes in the absence of competitor. These complexes were displaced by excess unlabeled AT-rich sequence and partially abolished by AT-rich Mut1 and Mut3. The super-shifted bands were only seen in α1ACTWT–FLAG nuclear extracts treated with FLAG-M2 antibodies, but not in lane of pCDNA3 nuclear extracts. (H) EMSA shows that the TTATAA region is critical for the formation of nucleoprotein complexes with AT-rich element. (I) α1ACTWT significantly increases BTG1 enhancer activity through intact TTATAA region. Plasmid pRL-TK is used as transfection efficiency control. Data are mean ± SEM, n ≥ 3 (each involving triplicate assays, *p<0.05 vs. control construct) (see also Figure S3).
Figure 4
Figure 4. α1ACT enhances neurite outgrowth by regulating BTG1 expression
(A) Relative mRNA expression levels of BTG1, PMCA2, TAF and GRN in PC12 cells transfected with α1AWT, α1ACTWT or α1ACTSCA6 (n ≥ 3). (B and C) Western blot (B) and quantitation of protein expression levels of BTG1 and PMCA2 in PC12 cells transfected with α1AWT, α1ACTWT and α1ACTSCA6 (C). (D) Relative levels of BTG1 mRNA in the cerebellum from two SCA6 patients, normalized to Pcp2. (E and F) α1ACTWT enhances neurite outgrowth. Representative low- and high-magnification images of PC12 cells with transiently transfected pcDNA3-FLAG, α1AWT-FLAG, α1ACTWT-FLAG and α1ACTSCA6-FLAG at 24 hr (E) and 72 hr after NGF treatment (F). Cells were labeled for GAP-43 (green) to visualize PC12 cell body and neurites. (G and H) Quantitation of average neurite length and percentage of neuritis per cell (n = 200; *p<0.05 versus pcDNA3-FLAG). (I) α1ACTWT up-regulates BTG1 gene and increases PRMT1/BTG1 protein interaction. (J and K) Silencing of BTG1 expression inhibits α1ACTWT-enhanced neurite outgrowth. Anti-FLAG staining is shown in red. (L) Quantitation of neurite outgrowth by siBTG1 in transfected cells (n = 3, *p<0.05). The blunted effect by α1ACTSCA6-FLAG was also diminished by BTG1 silencing. Data are mean ± SEM (see also Figure S4).
Figure 5
Figure 5. α1A−/−/PC-α1ACTWT transgenic mice have improved phenotype and development of cerebellar cortex compared to α1A−/− mice
(A and B) The genotype (A) and appearance (B) of α1A−/−/PC-α1ACTWT mice. (C) α1A−/−/PC-α1ACTWT mice had slightly greater body weight compared with α1A−/− mice at age of P14 (*p<0.05). (D) The lifespan of α1A−/−/PC-α1ACTWT mice was significantly improved compared to α1A−/− (*p<0.05). Some pups survived until age of P30 (n = 2, not included in the Figure), while all α1A−/− pups died before P20. (E-H) α1ACT expression improves cerebellar cortex and PC dendrites. Low power images of cerebellar ML (E). PC dendrites are labeled for calbindin-28 kDa (green). The thickness of the ML (F), the relative height of dendritic tree (G), and the density (as defined in Methods) of the PC dendritic tree (H) were reduced in α1A−/− mice and partially corrected in α1A−/−/PC-α1ACTWT mice (100 dendritic trees from 5 mice at each group. Control is set as 1, *p<0.05). (I) Immunolabeling of PFs and PC dendrites using anti-vGlut1 (red) and anti-calbindin (green) antibodies. (J) Immunolabeling of CFs and PC dendrites using anti-vGlut2 (red) and anti-calbindin (green) antibodies. (K and L) Quantitation of CF reach (K) and relative height of dendritic tree (L) (100 CFs, *p<0.05). CF height was measured from the apical pole of PC somata to the tips of vGluT2 labeled CFs. Data are mean ± SEM (see also Figure S5).
Figure 6
Figure 6. α1ACT partially restores PF EPSC amplitude but does not affect CF innervation or EPSC properties
(A) PF-EPSC amplitude as a function of stimulus intensity for α1A−/− (n = 9, N = 4), α1A−/−/PC-α1ACT (n = 16, N = 6), and WT (n = 11, N = 3) mice. Top: Typical PF-EPSCs at a stimulus intensity of 45 μA. (B) Paired-pulse ratios as a function of stimulus interval in α1A−/−, α1A−/−/PC-α1ACT, and WT mice. Inset shows an overlay of representative traces from all three groups of mice with an interstimulus interval of 20 ms. EPSC1 from α1A−/−/PC-α1ACT and WT mice were scaled to match the amplitude of EPSC1 from the α1A−/− mouse to facilitate comparison. (C) Top: Representative CF-EPSCs elicited while holding at -30 mV. Bottom left: CF-EPSC amplitudes for α1A−/− (n = 10, N = 3), α1A−/−/PC-α1ACT (n = 11, N = 3), and WT (n = 8, N = 3) mice. Bottom right: Paired-pulse depression of CF-EPSCs with 200 ms stimulus interval. (D) Left: representative traces from PCs in α1A−/− and α1A−/−/PC-α1ACT mice exhibiting multiple CF innervation. Right: Percentage of PCs exhibiting either one, two, or three discrete CF steps in α1A−/− (2 steps: 6/13, 3 steps: 1/13, N = 3), α1A−/−/PC-α1ACT (2 steps: 5/13, N = 3), and WT (2 Steps: 1/9, N = 3) mice. All mice were age P16-18. *p<0.05, **p<0.01. Data are mean ± SEM.
Figure 7
Figure 7. α1ACTSCA6 is a pathogenic fragment
(A) Representative fluorescence dot blots of FITC–Annexin V and propidium iodide (PI) stained PC12 cells with stably-transfected pcDNA3-FLAG, α1ACTWT-FLAG and α1ACTSCA6-FLAG. (B and C) Quantitation of Annexin V and PI positive cells (*p<0.05). (D) Cell death as measured by LDH release assay (*p<0.05). (E) Expression levels of α1ACTWT and α1ACTSCA6 in cerebellar homogenates by qRT-PCR. (F) Double support of Hind paw was impaired in PC-α1ACTSCA6 transgenic mice compared with PC-α1ACTWT transgenic mice at age 3-month, 9-month old (**p<0.01). (G and H) Cerebellar cortical atrophy in PC-α1ACTSCA6 transgenic mice. Low power images of cerebellar ML in mice at ages of 20-26 months (G) and Quantitation of ML thickness (H) (*p<0.05). PCs dendrites are labeled for calbindin (green). (I) Schematic illustration of expression regulation and function of α1ACT. Data are mean ± SEM(see also Figure S6).

Comment in

References

    1. Baird SD, Turcotte M, Korneluk RG, Holcik M. Searching for IRES. RNA. 2006;12:1755–1785. - PMC - PubMed
    1. Baker M, Mackenzie IR, Pickering-Brown SM, Gass J, Rademakers R, Lindholm C, Snowden J, Adamson J, Sadovnick AD, Rollinson S, et al. Mutations in progranulin cause tau-negative frontotemporal dementia linked to chromosome 17. Nature. 2006;442:916–919. - PubMed
    1. Berthet C, Guehenneux F, Revol V, Samarut C, Lukaszewicz A, Dehay C, Dumontet C, Magaud JP, Rouault JP. Interaction of PRMT1 with BTG/TOB proteins in cell signalling: molecular analysis and functional aspects. Genes to cells : devoted to molecular & cellular mechanisms. 2002;7:29–39. - PubMed
    1. Cain SM, Snutch TP. Voltage-gated calcium channels and disease. Biofactors. 2011;37:197–205. - PubMed
    1. Catterall WA. Voltage-gated calcium channels. Cold Spring Harbor perspectives in biology. 2011;3:a003947. - PMC - PubMed

Publication types

MeSH terms