. 2013 Jul 3;154(1):197-212.
doi: 10.1016/j.cell.2013.06.013.

A systems analysis identifies a feedforward inflammatory circuit leading to lethal influenza infection

Affiliations

A systems analysis identifies a feedforward inflammatory circuit leading to lethal influenza infection

Marlène Brandes et al. Cell. .

Abstract

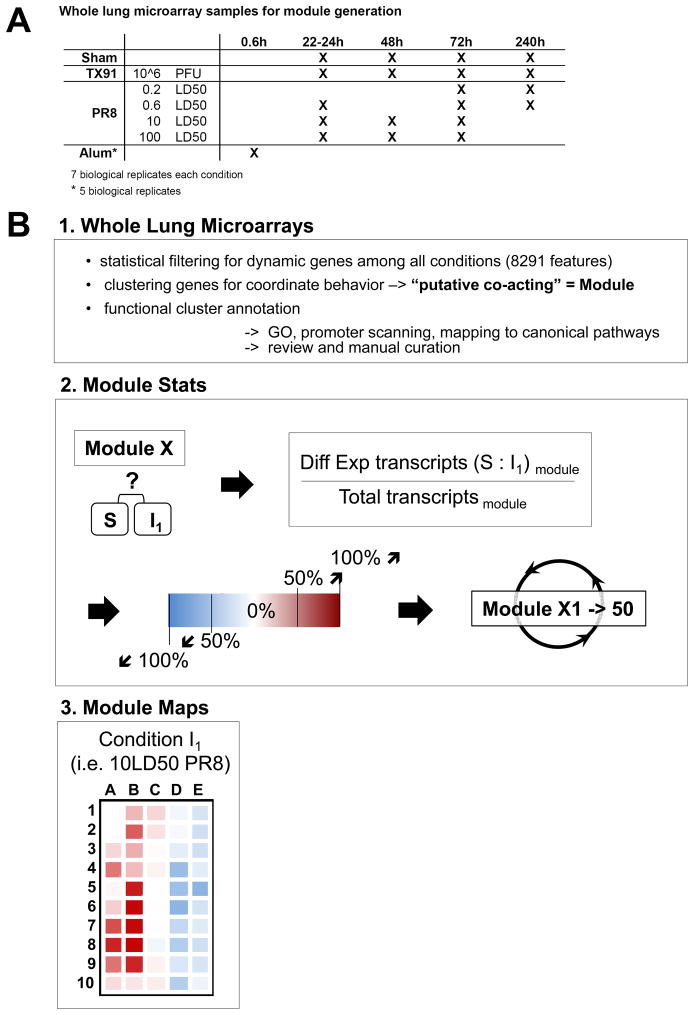
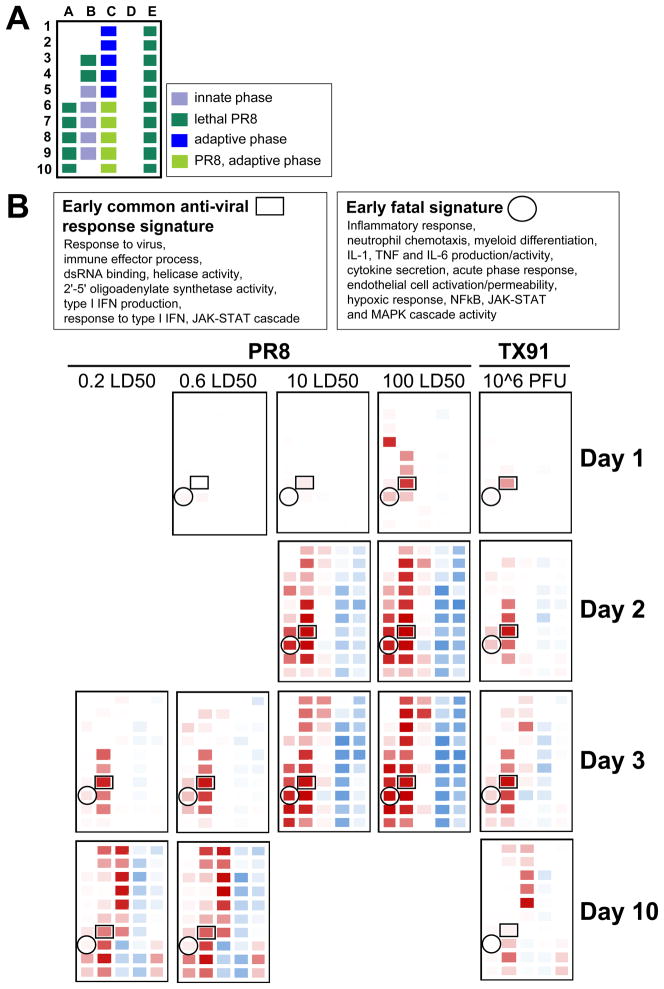
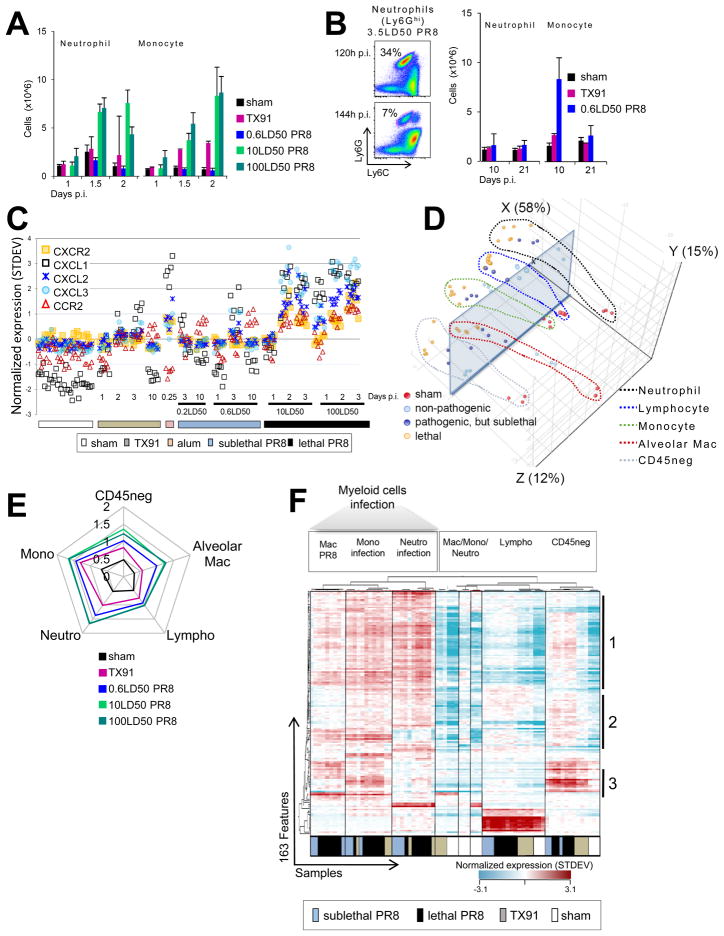
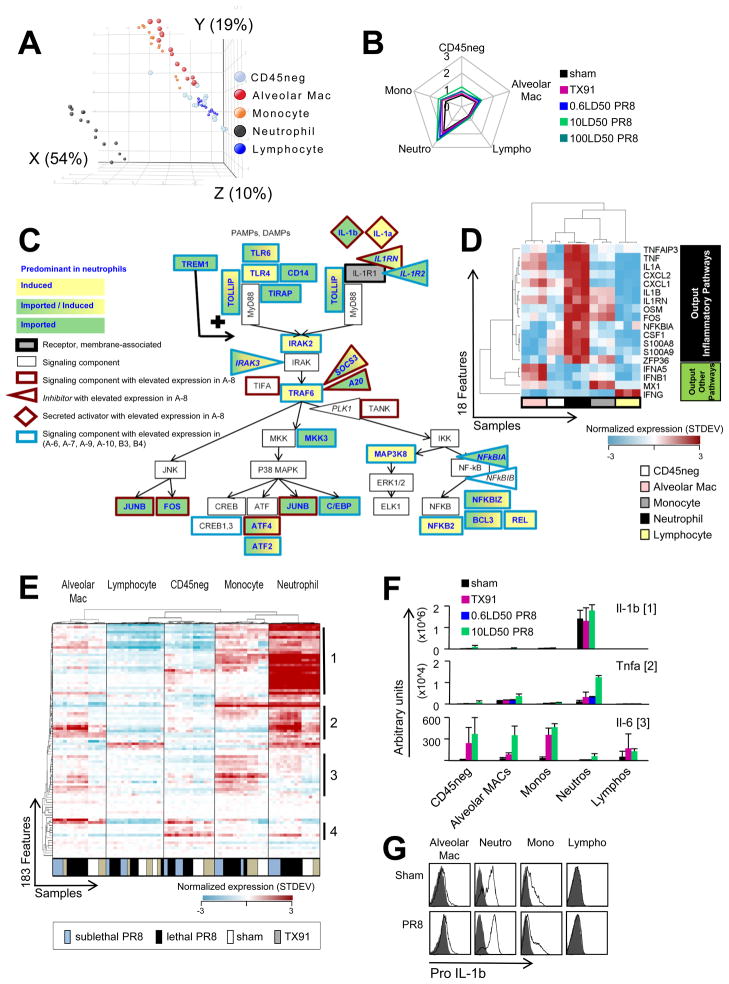
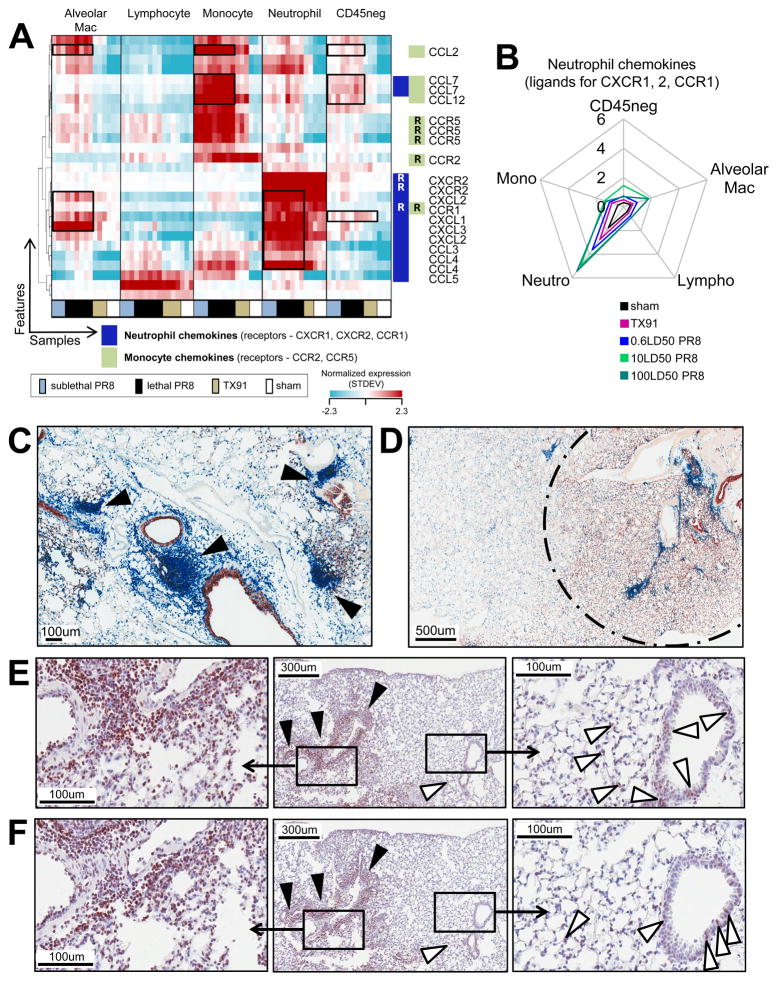
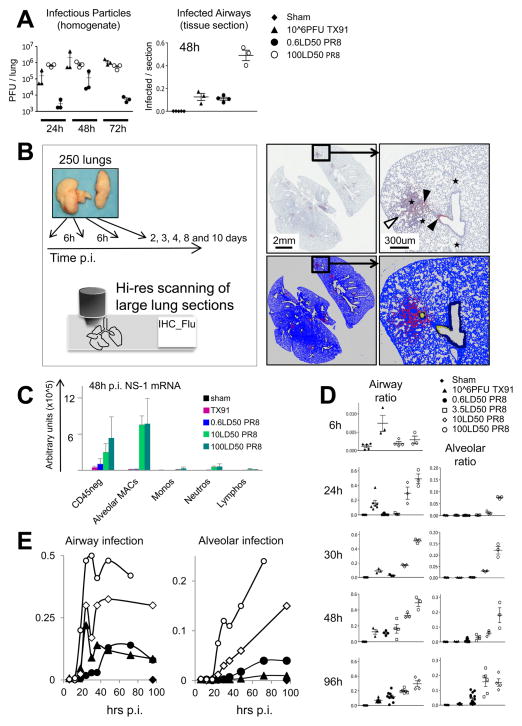
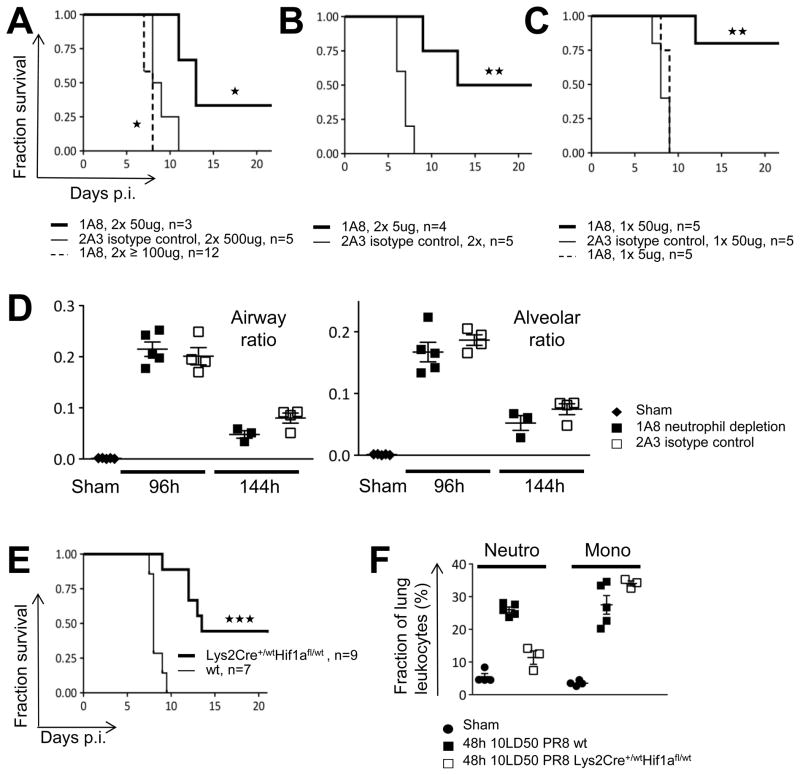
For acutely lethal influenza infections, the relative pathogenic contributions of direct viral damage to lung epithelium versus dysregulated immunity remain unresolved. Here, we take a top-down systems approach to this question. Multigene transcriptional signatures from infected lungs suggested that elevated activation of inflammatory signaling networks distinguished lethal from sublethal infections. Flow cytometry and gene expression analysis involving isolated cell subpopulations from infected lungs showed that neutrophil influx largely accounted for the predictive transcriptional signature. Automated imaging analysis, together with these gene expression and flow data, identified a chemokine-driven feedforward circuit involving proinflammatory neutrophils potently driven by poorly contained lethal viruses. Consistent with these data, attenuation, but not ablation, of the neutrophil-driven response increased survival without changing viral spread. These findings establish the primacy of damaging innate inflammation in at least some forms of influenza-induced lethality and provide a roadmap for the systematic dissection of infection-associated pathology.


Figures

Figure 1
Figure 1. Experimental Scheme and Generation of Modular Co-regulated Gene Sets
(A) Transcript expression data were derived using microarrays from RNA of whole mouse lungs representing 19 experimental conditions each with 7 biological replicates and these data used to define putative co-acting biological processes (modules). (B) Generation of modular gene expression maps. (B1) One-way ANOVA testing assuming unequal variance was used to define dynamic features with a corrected p-value <0.001 based on multiple testing correction. K-means clustering (k=50) was applied to group the 8291 dynamic features across all tested conditions (including an additional group consisting of intranasal alum administration) into 50 modules based on shared expression pattern. The modules were functionally annotated based on highly enriched GO terms. (B2) The fraction of differential expressed features per module was calculated based on lung samples from sham-treated (S) and infected animals (I) and transformed into a color-code. (B3) Matrix maps show the status of all modules for each infectious condition. The statistics for all the 50 modules (X1 to X50) for one representative infectious condition (10LD50 PR8) are shown in a map in which each square from A-1 to E-10 represents one of the 50 modules. The direction of the change (transcript decrease= blue, no change = white, increase = red), and the fractions of genes within each module contributing to the change (intensity of red or blue) were computed for each of the 15 different infectious settings (I1 to I15) to produce a modular map of this type for all tested conditions. See also Figure S1 and Table S1.
Figure 2
Figure 2. Modular Map Analysis Reveals Early Shared Anti-viral Signatures and Condition-specific Inflammatory Signatures
(A) Module assignments to different phases of the host response and infectious conditions. (B) Identification of key modules associated with evolving anti-viral responses shared across infectious conditions vs. lethality-associated inflammatory processes. Change in module B-7 transcript frequency preceded the emergence of the common anti-viral pattern, whereas change in A-8 was the leading indicator of the development of the inflammatory pattern. Text boxes to the left display a summary of the GO term enrichment attributed to the modules B-7 and A-8. See also Figure S2 and Table S2 and S3.
Figure 3
Figure 3. Microarrays from Flow-sorted Cells Reveal the Activation of Anti-viral and Interferon Pathways in Multiple Cell Types
(A) Early changes in the cellular composition of lungs from infected animals involving inflammatory monocytes and neutrophils. (B) Decline in the neutrophil but not monocyte infiltrate with the rising adaptive response. (C) Changes in CXCR2 mRNA in whole lung samples reflect changes in the neutrophil infiltrate size. (D) PCA analysis of the transcriptomic response to influenza infection represented in module B-7. Visualization of the major difference between samples is supported by a transparent plane. (E) Quantitative ‘spider-plot’ representation of condition-associated changes in transcripts defining module B-7. (F) Unsupervised hierarchical clustering of the 163 B-7 features and the 74 “SortedCell” microarray samples. Sub-grouped gene lists [1–3] are reported in Table S6. See also Figure S3 and Tables S4 and S5. Error bars represent SD.
Figure 4
Figure 4. Neutrophil Infiltrates Largely Account for the Lethality-associated Signature Involving Inflammatory Signaling Networks
(A) PCA for the 74 “SortedCell” microarray samples based on module A-8 features. (B) Quantitative ‘spider-plot’ representation of condition-associated changes in transcripts defining module A-8. (C) Inflammatory pathway signaling components elevated in module A-8 (outline red) and other modules associated with fatal disease (outline blue) and predominant expression in neutrophils (constitutive [fill green, import], activation-dependent [fill yellow, induction] or further induced but constitutive [fill green/yellow]). (D) Heat map shows unsupervised hierarchical clustering of downstream genes from inflammatory signaling cascades and reveals highest expression in neutrophil samples (microarrays 10LD50 PR8). (E) Unsupervised hierarchical clustering of the 183 A-8 features and the 74 “SortedCell” microarray samples showing cell-type segregation and a major fraction of transcripts (subgroup 1 and 2) largely associating with neutrophils. (F) qPCR validation of microarray data for inflammatory cytokine transcripts from different subgroups of genes within A-8 (subgroup membership = numbers to the right of the heat map). Error bars represent SD. (G) Pro-IL-1β protein levels in various hematopoietic cells from infected lungs assessed by flow cytometry (pro-IL-1β staining = open histograms; isotype-control = grey filled histograms). See also Figure S4 and Table S7.
Figure 5
Figure 5. Two Self-reflexive Chemokine Feed-forward Loops Involving Myeloid Cells from Infected Lungs
(A) Hierarchical clustering of chemokine and chemokine receptor mRNA levels for “SortedCell” samples. (B) Quantitative ’spider-plot’ representation of neutrophil chemokine expression data. (C, D) Virus protein expression (red-brown) and leukocyte distribution (CD45, blue) in the lung tissue of animals infected with a lethal dose of PR8. Focal leukocyte distribution pattern in the interstitial tissue at (C) 36h p.i. with 10LD50PR8 or (D) 24h p.i. with 100LD50 PR8 is shown; infected lung tissue = area within dashed circle. (E, F) (E) CCL2 and (F) TNFα protein expression (red-brown) at 36h p.i. in the lung tissue of animals infected with 10LD50PR8. Interstitial leukocytic infiltrate denoted by black arrow heads. Cells in the broncho-alveolar lining are denoted by white arrowheads. See also Figure S5.
Figure 6
Figure 6. Early Poorly Controlled Infectious Spread of Pathogenic Virus Revealed by Automated Image Analysis
(A) Pulmonary infectious particle loads after infection with influenza virus, assessed using lung homogenates and standard TCID50 assay (left panel). Infection load assessed by immunohistochemistry for viral proteins at 48h p.i., expressed as the ratio of infected versus total lung tissue per section based on the area quantification (right panel). Each mark represents the section statistics for an individual animal and bars indicate mean and SD. (B) Scheme for time-resolved analysis of influenza infection using automated image analysis. Sections stained for virus proteins (counterstained with hematoxylin) were scanned and quantified, distinguishing between infected airways and infected lung parenchyma (alveoli). Scan of an entire section (3.5LD50 PR8, 48h p.i.) (upper left) and detailed view (upper right) with virus-stain (red-brown) and counterstain (blue-grey). Infected airways (black arrow heads) and infected alveoli (white arrow heads) were distinguished by the software. Large and middle size vessels (black star) were also distinguished from airways. The software-generated transformation of the imaging data (lower panels) shows “lung tissue” (blue, dark blue), airways (dark blue), and alveoli/vessels (blue) Alveoli-associated virus signals (red) are distinguished from airway-related viral signals (yellow). (C) Validation of the in situ image analysis data using qPCR for NS-1. Error bars represent SD. (D) Automated in situ analysis at 6, 24, 30, 48, and 96h p.i. Each mark represents an individual animal as indicated in A. (E) In situ dynamics of the infection load based on mean values for the entire innate phase involving all time points between 6 and 96h p.i. Symbols are the same as indicated in D. See also Figure S6.
Figure 7
Figure 7. Attenuation of Lethality-preceding Neutrophil Influx Improves Survival without Changing Infection Loads
(A–C) Survival plots for animals treated with varying neutrophil depletion regimens. Stars indicate significance level. (D) Infection loads in neutrophil-depleted animals. Each mark represents the section-based infection load for an individual animal. (E) Survival curves for animals with diminished myeloid cell recruitment in Hif-1a (Lys2Cre+/−Hif1afl/wt) animals. (F) Myeloid cells in infected WT and Hif-1a (Lys2Cre+/−Hif1afl/wt) animals. The cellular composition in lung homogenates was determined by flow cytometry and each mark represents an individual animal. Bars indicate mean and SD. See also Figure S7.

Comment in

  • Influenza virus: lethal weapons.
    Leavy O. Leavy O. Nat Rev Immunol. 2013 Aug;13(8):543. doi: 10.1038/nri3502. Epub 2013 Jul 19. Nat Rev Immunol. 2013. PMID: 23868220 No abstract available.

References

    1. Aldridge JR, Jr, Moseley CE, Boltz DA, Negovetich NJ, Reynolds C, Franks J, Brown SA, Doherty PC, Webster RG, Thomas PG. TNF/iNOS-producing dendritic cells are the necessary evil of lethal influenza virus infection. Proc Natl Acad Sci U S A. 2009;106:5306–5311. - PMC - PubMed
    1. Allen IC, Scull MA, Moore CB, Holl EK, McElvania-TeKippe E, Taxman DJ, Guthrie EH, Pickles RJ, Ting JP. The NLRP3 inflammasome mediates in vivo innate immunity to influenza A virus through recognition of viral RNA. Immunity. 2009;30:556–565. - PMC - PubMed
    1. Bautista E, Chotpitayasunondh T, Gao Z, Harper SA, Shaw M, Uyeki TM, Zaki SR, Hayden FG, Hui DS, Kettner JD, et al. Clinical aspects of pandemic 2009 influenza A (H1N1) virus infection. N Engl J Med. 2010;362:1708–1719. - PubMed
    1. Beigel JH, Farrar J, Han AM, Hayden FG, Hyer R, de Jong MD, Lochindarat S, Nguyen TK, Nguyen TH, Tran TH, et al. Avian influenza A (H5N1) infection in humans. N Engl J Med. 2005;353:1374–1385. - PubMed
    1. Boon AC, Finkelstein D, Zheng M, Liao G, Allard J, Klumpp K, Webster R, Peltz G, Webby RJ. H5N1 influenza virus pathogenesis in genetically diverse mice is mediated at the level of viral load. MBio. 2011:2. - PMC - PubMed

Publication types

MeSH terms