. 2013 Jul 3;154(1):213-27.
doi: 10.1016/j.cell.2013.05.052.

Lipidomic profiling of influenza infection identifies mediators that induce and resolve inflammation

Affiliations

Lipidomic profiling of influenza infection identifies mediators that induce and resolve inflammation

Vincent C Tam et al. Cell. .

Abstract

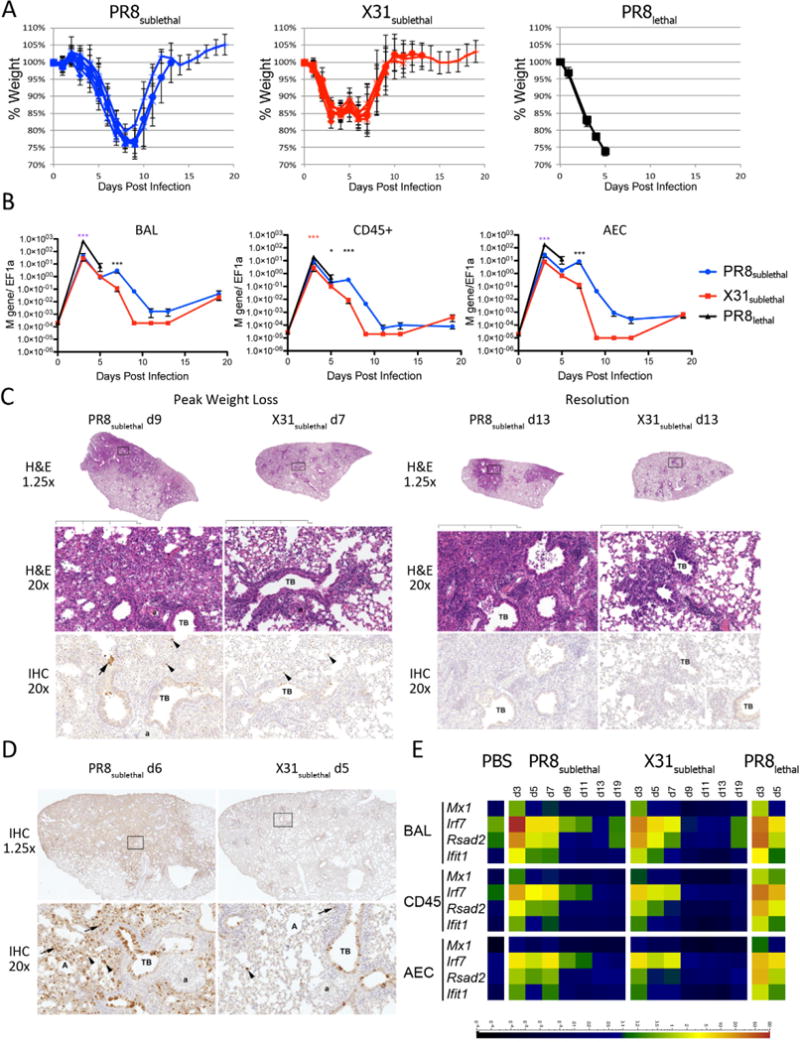
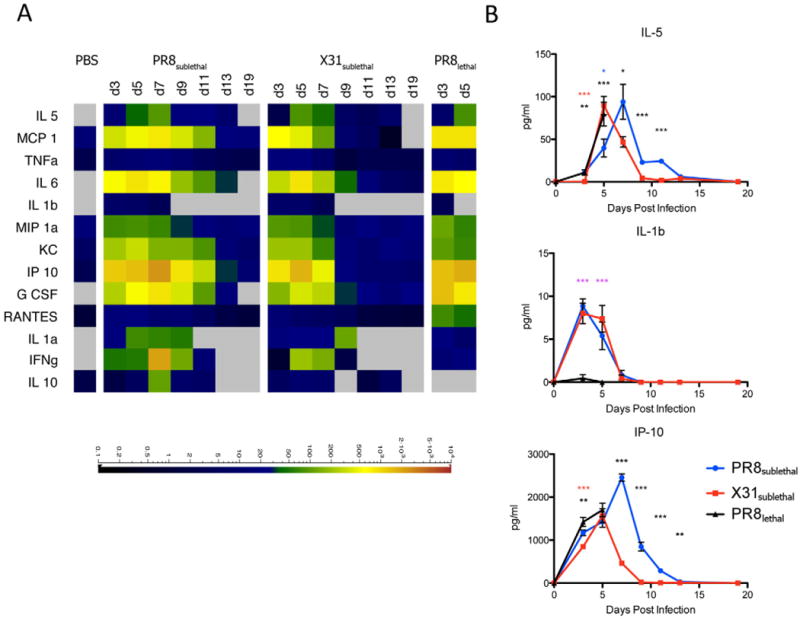
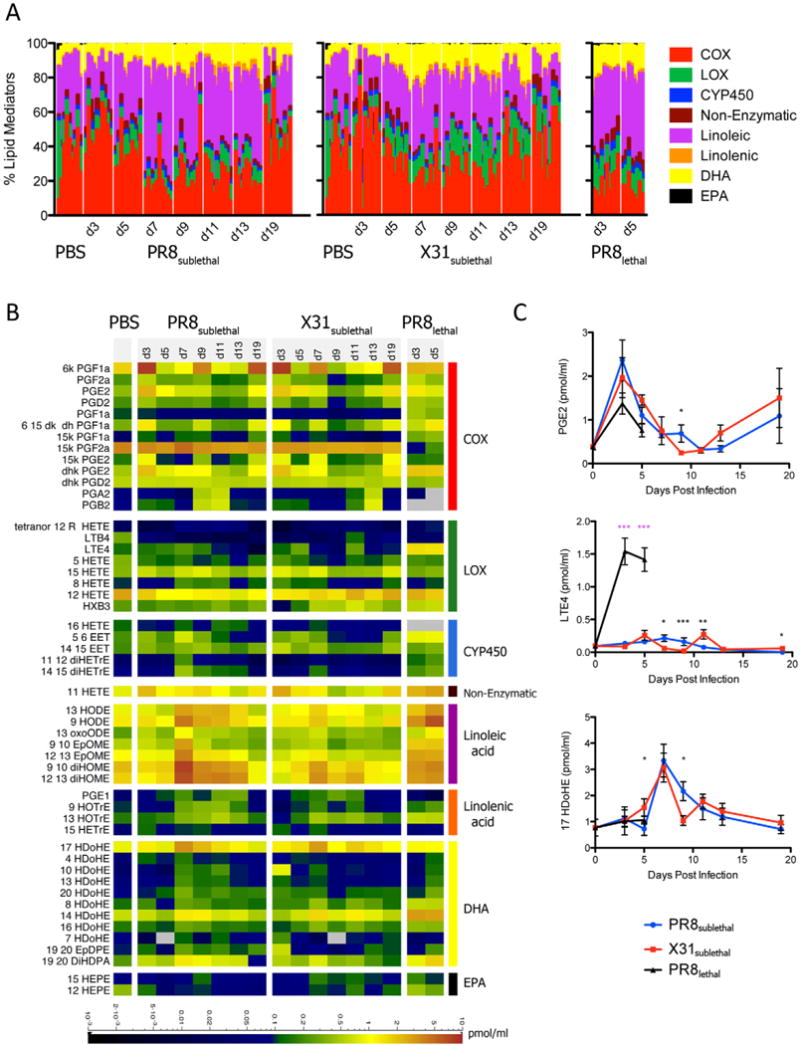
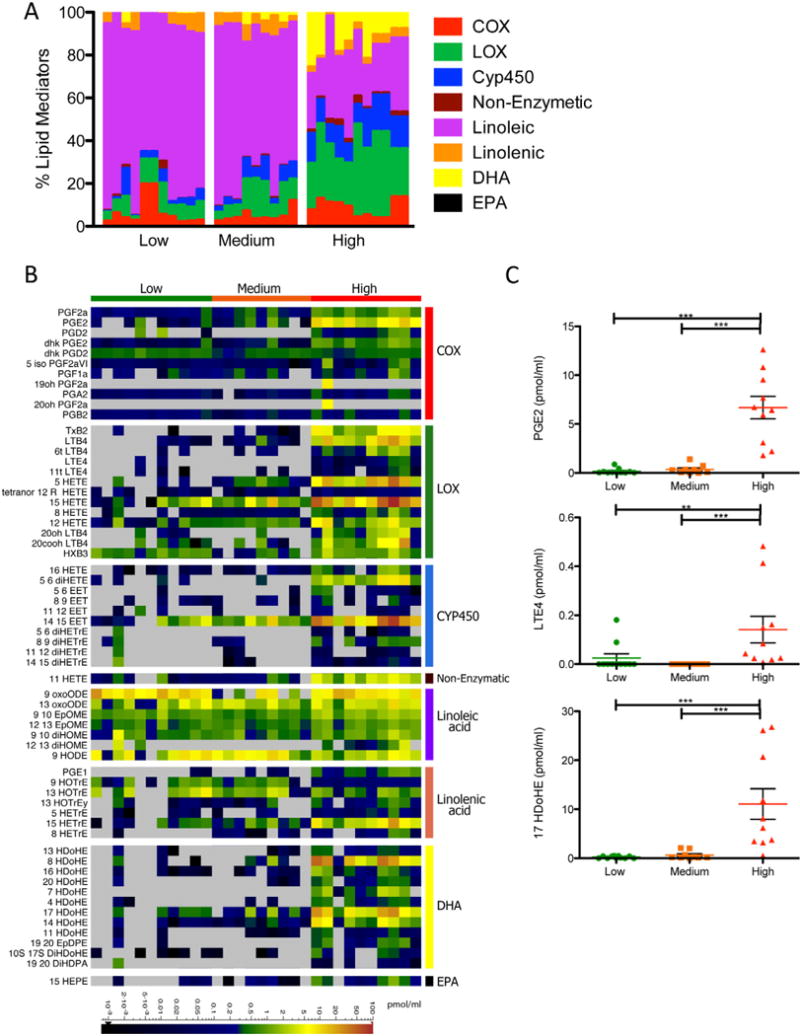
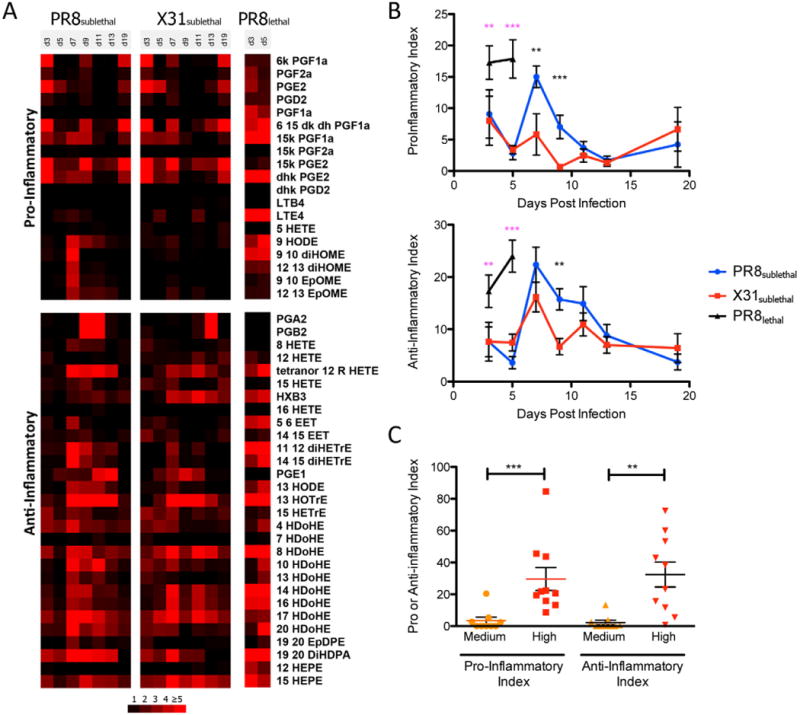
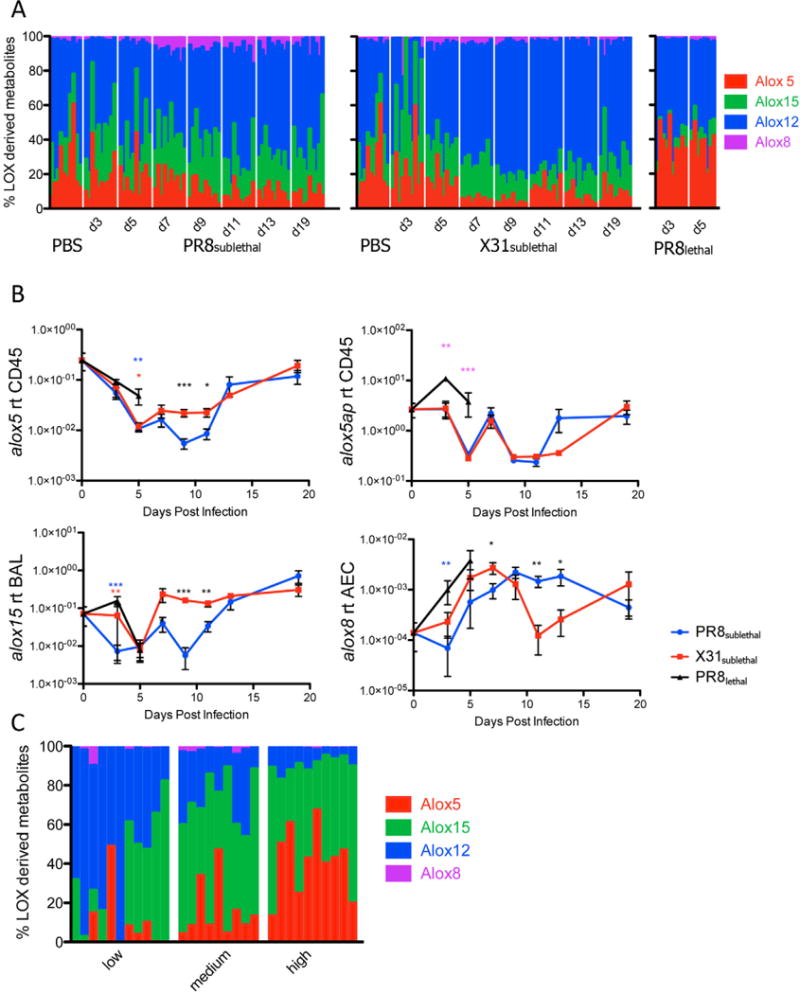
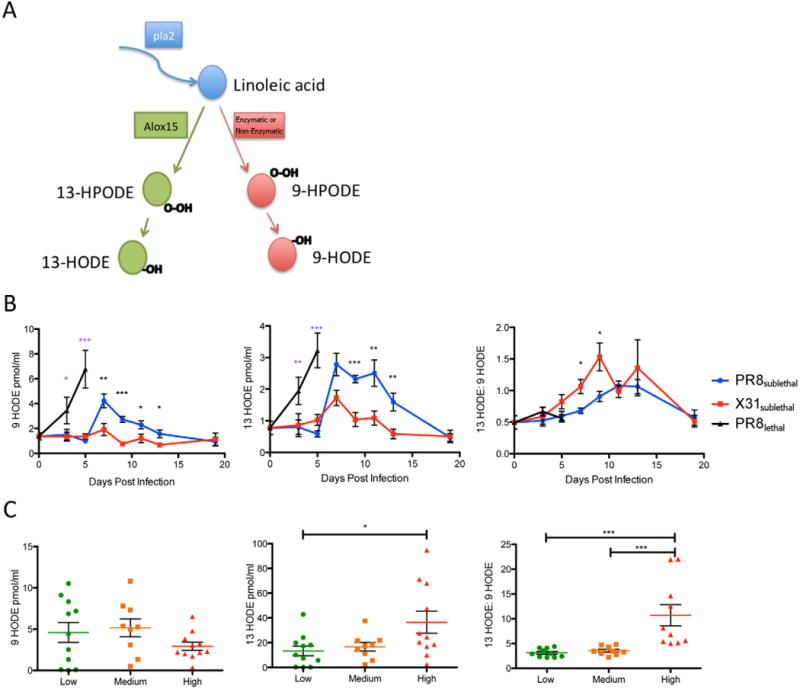
Bioactive lipid mediators play a crucial role in the induction and resolution of inflammation. To elucidate their involvement during influenza infection, liquid chromatography/mass spectrometry lipidomic profiling of 141 lipid species was performed on a mouse influenza model using two viruses of significantly different pathogenicity. Infection by the low-pathogenicity strain X31/H3N2 induced a proinflammatory response followed by a distinct anti-inflammatory response; infection by the high-pathogenicity strain PR8/H1N1 resulted in overlapping pro- and anti-inflammatory states. Integration of the large-scale lipid measurements with targeted gene expression data demonstrated that 5-lipoxygenase metabolites correlated with the pathogenic phase of the infection, whereas 12/15-lipoxygenase metabolites were associated with the resolution phase. Hydroxylated linoleic acid, specifically the ratio of 13- to 9-hydroxyoctadecadienoic acid, was identified as a potential biomarker for immune status during an active infection. Importantly, some of the findings from the animal model were recapitulated in studies of human nasopharyngeal lavages obtained during the 2009-2011 influenza seasons.


Figures

Figure 1
Figure 1
Mouse Influenza Infection Model. (A) Weight loss curves of mice infected with PR8sublethal 200 PFU (Blue), X31sublethal 2× 10⁵ PFU (Red), or PR8lethal 2× 10⁵ PFU (Black) on day 0. Graphs depict mean +/− SEM. (B) Viral loads in BAL (left), CD45+ immune cells (middle), or alveolar epithelium (right) as measured by RT-PCR using Fluidigm. Mann-Whitney tests were performed to determine statistical significance (* 0.01<p <0.05; ** 0.001<p<0.01; *** p<0.001; magenta asterisks denote significance between PR8lethal and both X31sublethal and PR8sublethal infections; blue and red asterisks denote significance between PR8lethal and PR8sublethal or X31sublethal infections, respectively; black asterisks denote significance between PR8sublethal and X31sublethal infections). (C) Representative hematoxylin and eosin (H&E) and anti-influenza antibody –stained sections from PR8 and X31-sublethally infected lungs. Days Post Infection, magnifications, terminal bronchioles (TB), arterioles (a) and alveoli (A) as indicated. Boxed regions on sub-gross images (1.25×) correspond to the regions shown at 20× for both H&E and IHC panels except for PR8 at d9 where the sections are stepped; note that the same terminal bronchiole and arteriole are present in both panels. Boxed inset in lower right X31 IHC panel is an example of the control IgG-stained tissue. Black bar represents 2mm. (D) Representative IHC from PR8 D6 and X31 D5 infected lung sections. Brown staining indicates presence of antigen. Arterioles are indicated (a). (E) Antiviral response represented as heatmap of RT-PCR data detected in BAL, CD45+, or AEC (alveolar epithelial cells). Scale bar represents normalized value to EF1α. See also Figure S1.
Figure 2
Figure 2
Cytokine and Chemokine Responses in Mouse Influenza Infections. (A) Cytokine and chemokine levels detected in BAL by multiplex Luminex respresented as a heatmap. Scale represents the amount of protein in pg/ml. (B) Line graphs of selected representative cytokines/chemokines depicting the mean +/− SEM. See also Figure S2.
Figure 3
Figure 3
Lipidomic Profiling of Mouse Influenza Infection. (A) Stacked bar graph representing the percentages of arachidonic acid derived cyclooxygenase (COX), lipoxygenase (LOX), and cytochrome P450 (CYP450) metabolites, as well as linoleic, linolenic acid, DHA, and EPA derived metabolites. Each vertical line represents data from a single animal/sample (n=8–10). (B) Quantified lipid mediators represented as a heatmap. Scale bar represents levels measured in pmol/ml. (C) Line graphs of selected representative lipid mediators depicting the mean +/− SEM. See also Figure S3.
Figure 4
Figure 4
Lipidomic Profiling of Human Nasal Washes. (A) Stacked bar graph represents the percentages of arachidonic acid derived cyclooxygenase (COX), lipoxygenase (LOX), and cytochrome P450 (CYP450) metabolites, as well as linoleic, linolenic acid, DHA, and EPA derived metabolites. Each vertical line represents data from a single patient/sample, which is categorized into either the low, medium or high clinical score/immune response group (n=9–11). (B) Quantified lipid mediators represented as a heatmap. Scaled bar represents levels measured in pmol/ml. (C) Column vertical scatter plot of selected representative lipid mediators depicting the mean +/− SEM. See also Figure S4.
Figure 5
Figure 5
Pro- and Anti-inflammatory Indices of Mouse and Human Lipidomic Profiles. (A) Heatmap represents the mean fold change in each lipid mediator (separated by having either pro- or anti-inflammatory activity). (B) Line graphs of pro- and anti-inflammatory indices depicting the mean +/− SEM. (C) Column vertical scatter plot of pro- and anti-inflammatory indices for individual patient samples. Horizontal lines indicate the mean +/− SEM. See also Figure S5.
Figure 6
Figure 6
Lipoxygenase Enzymes and Derived Metabolites in Mouse and Human Influenza Infection. Stacked bar graph represents the percentages of lipoxygenase 5, 15, 12, or 8 derived metabolites of all lipoxygenase derived metabolites in mouse (A) or human (C) samples. Each vertical line represents data from a single sample (n=8–11 per time point). (B) Line graphs of 5 lipoxygenase (alox5), 5-lipoxygenase activating protein (alox5ap) in CD45+ cells, 15 lipoxygenase (alox15) in BAL, and 8 lipoxygenase (alox8) in alveolar epithelium depicting the mean +/− SEM. See also Figure S6.
Figure 7
Figure 7
Hydroxylated Linoleic acid Metabolites as a Biomarker for Immune Status During Influenza Infection. (A) Pathway for linoleic acid to generate 9-hydroxylated or 13-hydroxylated linoleic acid. (B) Line graphs of 9 HODE, 13 HODE, and 13:9 HODE in the mouse lung during influenza infection (red: X31sublethal; blue: PR8sublethal; black: PR8lethal). (C) Column vertical scatter plot of 9 HODE, 13 HODE, and 13:9 HODE in human nasal wash samples. Horizontal lines indicate mean +/− SEM. See also Figure S7.

Comment in

References

    1. Allan W, Tabi Z, Cleary A, Doherty PC. Cellular events in the lymph node and lung of mice with influenza. Consequences of depleting CD4+ T cells. J Immunol. 1990;144:3980–3986. - PubMed
    1. Altmann R, Hausmann M, Spöttl T, Gruber M, Bull AW, Menzel K, Vogl D, Herfarth H, Schölmerich J, Falk W, et al. 13-Oxo-ODE is an endogenous ligand for PPARgamma in human colonic epithelial cells. Biochem Pharmacol. 2007;74:612–622. - PubMed
    1. Ariel A, Serhan CN. Resolvins and protectins in the termination program of acute inflammation. Trends Immunol. 2007;28:176–183. - PubMed
    1. Bannenberg GL, Chiang N, Ariel A, Arita M, Tjonahen E, Gotlinger KH, Hong S, Serhan CN. Molecular circuits of resolution: formation and actions of resolvins and protectins. J Immunol. 2005;174:4345–4355. - PubMed
    1. Belvisi MG, Mitchell JA. Targeting PPAR receptors in the airway for the treatment of inflammatory lung disease. Br J Pharmacol. 2009;158:994–1003. - PMC - PubMed

Publication types

MeSH terms