. 2013 Jul 3;13(1):23-9.
doi: 10.1016/j.stem.2013.04.019.

Single-cell analysis reveals that expression of nanog is biallelic and equally variable as that of other pluripotency factors in mouse ESCs

Affiliations

Single-cell analysis reveals that expression of nanog is biallelic and equally variable as that of other pluripotency factors in mouse ESCs

Dina A Faddah et al. Cell Stem Cell. .

Abstract

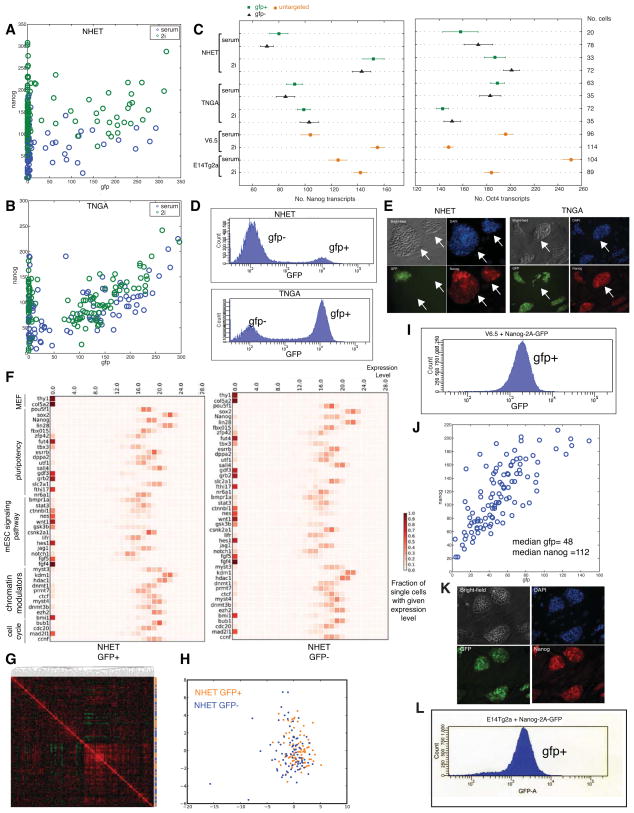
The homeodomain transcription factor Nanog is a central part of the core pluripotency transcriptional network and plays a critical role in embryonic stem cell (ESC) self-renewal. Several reports have suggested that Nanog expression is allelically regulated and that transient downregulation of Nanog in a subset of pluripotent cells predisposes them toward differentiation. Using single-cell gene expression analyses combined with different reporters for the two alleles of Nanog, we show that Nanog is biallelically expressed in ESCs independently of culture condition. We also show that the overall variation in endogenous Nanog expression in ESCs is very similar to that of several other pluripotency markers. Our analysis suggests that reporter-based studies of gene expression in pluripotent cells can be significantly influenced by the gene-targeting strategy and genetic background employed.


Figures

Figure 1
Figure 1. Nanog is biallelically expressed in ES cells and equally variable as that of other pluripotency factors
(A) Schematic of the NGNC reporter targeting. Four rounds of gene targeting were performed: (1) V6.5 ES cells targeted with Nanog-2A-GFP floxed pgk puro (2) Cre excision of the floxed pgk puro (3) Nanog-2A-GFP ES cells targeted with Nanog-2A-mCherry pgk neo (4) Cre excision of the floxed pgk neo (B) sm-mRNA-FISH of mCherry vs. GFP expression in single NGNC ES cells cultured with serum/LIF, 82 cells analyzed. (C) sm-mRNA-FISH of sum of mCherry and GFP vs. Nanog expression in single NGNC ES cells cultured with serum/LIF. (D) Box plot of GFP (green), mCherry (red), Nanog (Blue), and sum of GFP and mCherry (blue) transcripts in single cells, quantified by sm-mRNA-FISH. On each box, the central mark is the median, the edges of the box are the 25th and 75th percentiles, the whiskers extend to the most extreme datapoints not considered to be not outliers, and the outliers (+) are plotted individually. Points are drawn as outliers if they are larger than Q3+W*(Q3-Q1) or smaller than Q1−W*(Q3-Q1). (E) Flow cytometric analysis of NGNC ES cells in serum/LIF. (F–O) sm-mRNA-FISH of Oct4 vs. Nanog (F), Dnmt3b (G), Utf1 (H), Sox2 (I), Lin28 (J), Gapdh (K), Sall4(L), Tet1 (M), Klf2(N), and Stella (O) expression in single V6.5 ES cells cultured with serum/LIF. (P) Box plot of transcripts in single cells, quantified by sm-mRNA-FISH, of the genes in (F–O). On each box, the central mark is the median, the edges of the box are the 25th and 75th percentiles, the whiskers extend to the most extreme datapoints not considered to be not outliers, and the outliers (+) are plotted individually. Points are drawn as outliers if they are larger than Q3+W*(Q3-Q1) or smaller than Q1−W*(Q3-Q1). (Q) Coefficient of variation of the genes in (F–O). See also Figure S1A and S1B.
Figure 2
Figure 2. Nanog heterozygous loss of function knock-in reporters do not reflect Nanog expression
sm-mRNA-FISH of Nanog vs. GFP expression in single (A) NHET ES cells and (B) TNGA ES cells cultured in serum/LIF (blue) and 2i/LIF (green) condition. (NHET serum-102, NHET 2i -105, TNGA serum- 98, TNGA 2i-107 cells analyzed). (C) Plot of the median number of Nanog (left) and Oct4 (right) transcripts, quantified by sm-mRNA-FISH, in GFP+ (square, green) and GFP− (triangle, black) fractions of NHET and TNGA ES cells and V6.5 and E14Tg2a (untargeted ES cells) cultured in serum/LIF (serum) and 2i/LIF (2i) condition. Error bars represented standard error of the mean. (D) Flow cytometric analysis of GFP in NHET ES cells (top) and TNGA ES cells (bottom). (E) Representative bright-field image (upper left), DAPI (upper right), and immunostaining of GFP protein (bottom left) and Nanog protein (bottom right) of NHET (left) and TNGA (right) ES cells cultured in serum/LIF. White arrows indicate GFP−/Nanog+ cells. (F) Heatmap of gene expression values of single NHET GFP+ (left) and GFP− (right) ES cells. Fraction of single-cells with an expression level (top number) is indicated by color of the box (see key on right). The genes tested in this analysis included ES cell-associated chromatin remodeling genes and modification enzymes (Myst3, Kdm1, Hdac1, Dnmt1, Prmt7, Ctcf, Myst4, Dnmt3b, Ezh2, Bmi1), ES cell cell-cycle regulator genes (Bub1, Cdc20, Mad2l1, Ccnf), pluripotency markers (Oct4, Sox2, Nanog, Lin28, Fbxo15, Zfp42, Fut4, Tbx3, Esrrb, Dppa2, Utf1, Sall4, Gdf3, Grb2, Slc2a1, Fthi17, Nr6a1), MEF markers (Thy1 and Col5a2), and genes active in signal transduction pathways important for ES cell maintenance and differentiation (Bmpr1a, Stat3, Ctnnbl1, Nes, Wnt1, Gsk3b, Csnk2a1, Lifr, Hes1, Jag1, Notch1, Fgf5, Fgf4). (G) Hierarchical clustering of single NHET GFP+ and GFP− ES cells. Bar on right displays GFP+ (orange dot) and GFP− cells (blue dot). (H) Principal component (PC) projections of single NHET GFP+ (orange) and GFP− (blue) ES cells, colored by their sample identification. (I) Flow cytometric analysis of GFP in V6.5 + Nanog-2A-GFP ES cells cultured with serum/LIF.(J) sm-mRNA-FISH of Nanog vs. GFP expression in single V6.5 + Nanog-2A-GFP ES cells (pgk puro looped out) cultured with serum/LIF, 107 cells analyzed. (K) Representative bright-field image (upper left), DAPI (upper right), and immunostaining of GFP protein (bottom left) and Nanog protein (bottom right) of V6.5 + Nanog-2A-GFP ES cells cultured with serum/LIF (L) Flow cytometric analysis of GFP in E14Tg2a + Nanog-2A-GFP (pgk puro looped out) ES cells cultured with serum/LIF. See also Figures S1 and S2.

Comment in

References

    1. Buganim Y, Faddah DA, Cheng AW, Itskovich E, Markoulaki S, Ganz K, Klemm SL, van Oudenaarden A, Jaenisch R. Single-Cell Expression Analyses during Cellular Reprogramming Reveal an Early Stochastic and a Late Hierarchic Phase. Cell. 2012;150:1209–1222. - PMC - PubMed
    1. Chambers I, Colby D, Robertson M, Nichols J, Lee S, Tweedie S, Smith A. Functional expression cloning of Nanog, a pluripotency sustaining factor in embryonic stem cells. Cell. 2003;113:643–655. - PubMed
    1. Chambers I, Silva J, Colby D, Nichols J, Nijmeijer B, Robertson M, Vrana J, Jones K, Grotewold L, Smith A. Nanog safeguards pluripotency and mediates germline development. Nature. 2007;450:1230–1234. - PubMed
    1. Fidalgo M, Faiola F, Pereira CF, Ding J, Saunders A, Gingold J, Schaniel C, Lemischka IR, Silva JC, Wang J. Zfp281 mediates Nanog autorepression through recruitment of the NuRD complex and inhibits somatic cell reprogramming. Proc Natl Acad Sci U S A. 2012;109:16202–16207. - PMC - PubMed
    1. Filipczyk A, Gkatzis K, Fu J, Hoppe P, Lickert H, Anastassiadis K, Schroeder T. Biallelic expression of Nanog protein in mouse embryonic stem cells. Cell Stem Cell 2013 - PubMed