. 2013 Jul 3;13(1):87-101.
doi: 10.1016/j.stem.2013.06.003.

The oncogenic microRNA miR-22 targets the TET2 tumor suppressor to promote hematopoietic stem cell self-renewal and transformation

Affiliations

The oncogenic microRNA miR-22 targets the TET2 tumor suppressor to promote hematopoietic stem cell self-renewal and transformation

Su Jung Song et al. Cell Stem Cell. .

Abstract

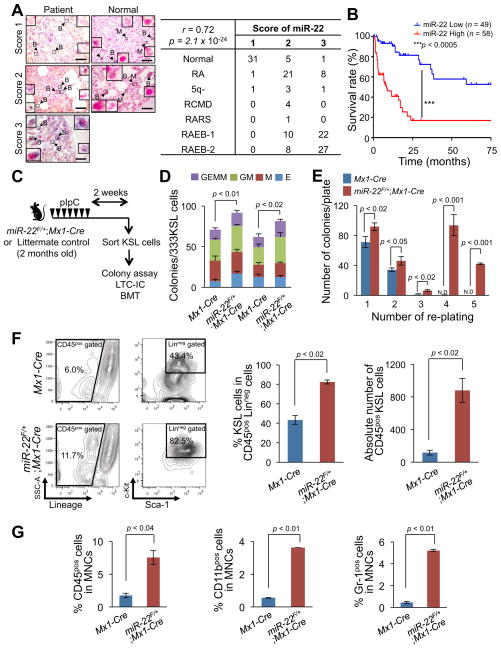
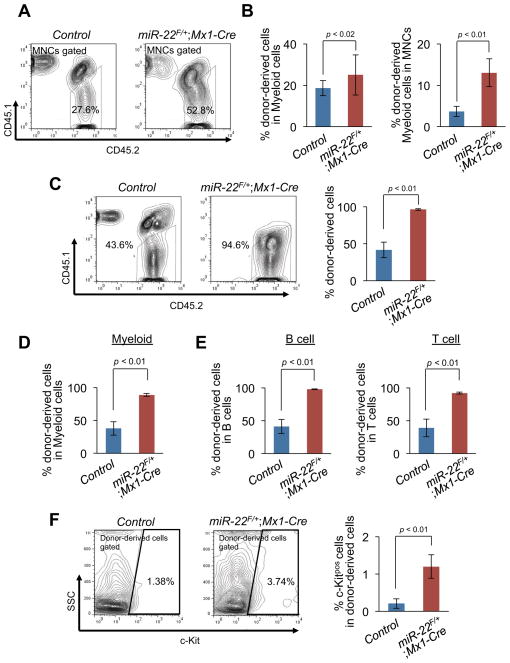
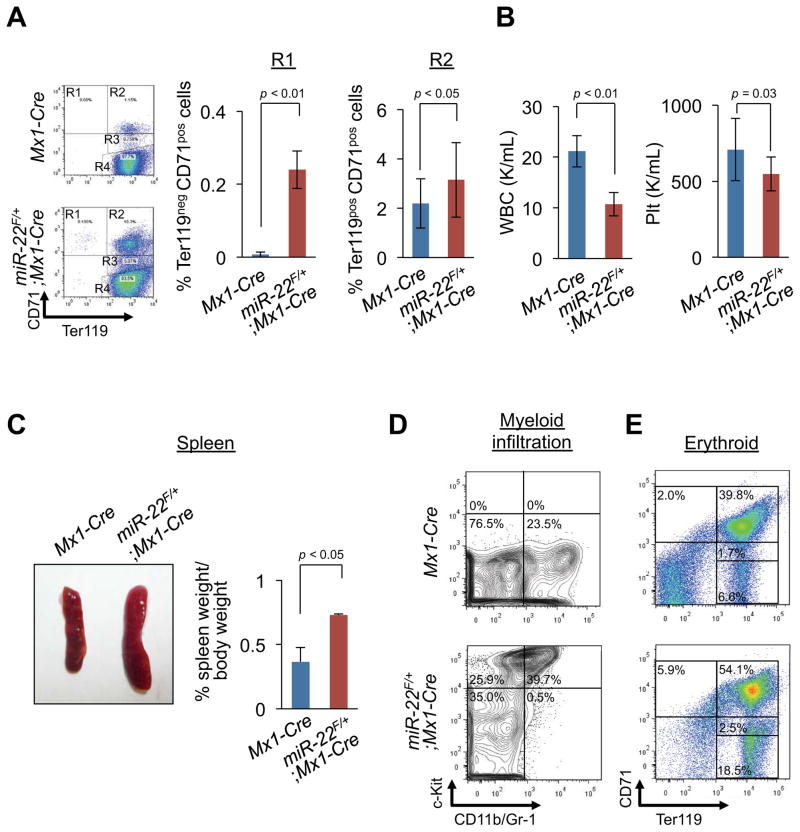
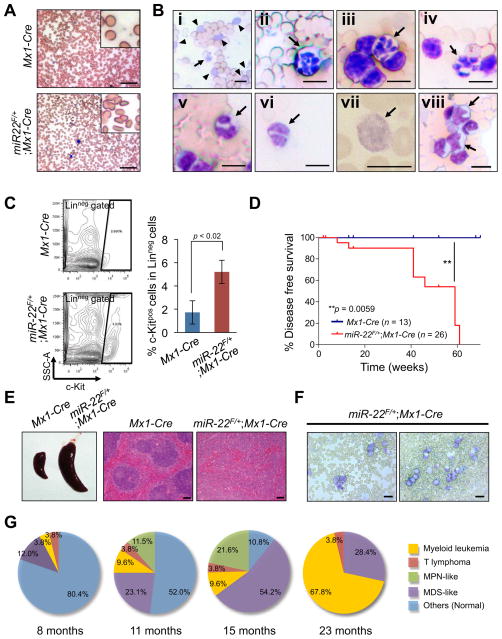
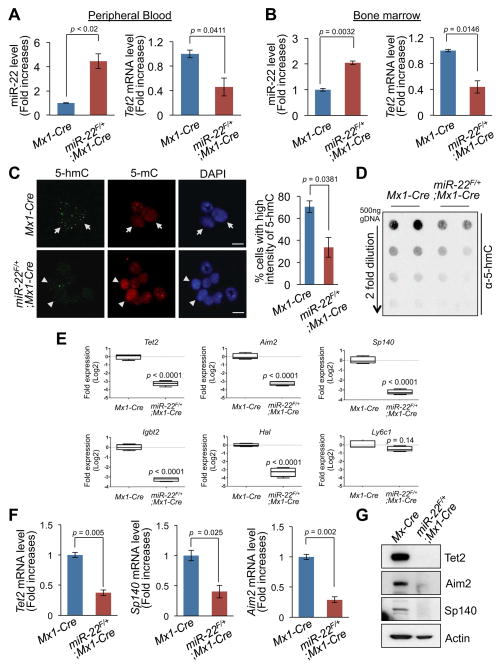
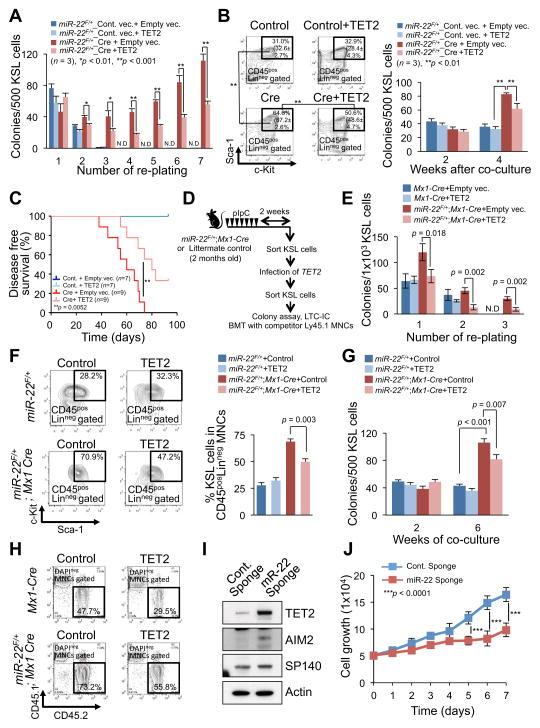
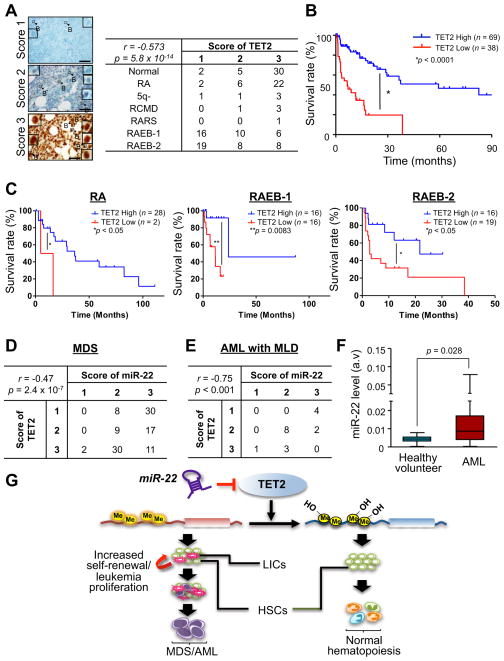
MicroRNAs are frequently deregulated in cancer. Here we show that miR-22 is upregulated in myelodysplastic syndrome (MDS) and leukemia and its aberrant expression correlates with poor survival. To explore its role in hematopoietic stem cell function and malignancy, we generated transgenic mice conditionally expressing miR-22 in the hematopoietic compartment. These mice displayed reduced levels of global 5-hydroxymethylcytosine (5-hmC) and increased hematopoietic stem cell self-renewal accompanied by defective differentiation. Conversely, miR-22 inhibition blocked proliferation in both mouse and human leukemic cells. Over time, miR-22 transgenic mice developed MDS and hematological malignancies. We also identify TET2 as a key target of miR-22 in this context. Ectopic expression of TET2 suppressed the miR-22-induced phenotypes. Downregulation of TET2 protein also correlated with poor clinical outcomes and miR-22 overexpression in MDS patients. Our results therefore identify miR-22 as a potent proto-oncogene and suggest that aberrations in the miR-22/TET2 regulatory network are common in hematopoietic malignancies.


Figures

Figure 1
Figure 1. miR-22 is upregulated in MDS patients and leads to increased replating capacity in vitro
(A) miR-22 is highly expressed in MDS patient samples. Expression levels of miR-22 in blasts in subtypes of MDS were measured by in situ hybridization analysis. Normal (n=37), RA (n=30), 5q- (n=5), RCMD (n=4), RARS (n=1), RAEB-1 (n=32) and RAEB-2 (n=35). Representative images of in situ hybridization for miR-22 in MDS patients and normal bone marrow are shown (left). Insets of panels show miR-22 staining in blasts (arrow with B) and in differentiated myeloid cells (e.g. neutrophil, arrow with M) with a high magnification. The expression levels of miR-22 were also scored as described in Extended Experimental Procedures (right). The data were analyzed by Chi-square test. r, Pearson’s r. Scale bars, 60 μm. (B) miR-22 overexpression correlates with poor survival rates of human MDS patients. MDS patients were divided into two groups; low miR-22 expressing patients group (miR-22 Score 1 or 2, n=49, blue) and high miR-22 expressing patients group (miR-22 Score 3, n=58, red). Overall survival of these patients is demonstrated. P-value was generated by log-rank test. (C) Overview of the experimental design for the conditional miR-22 expression in hematopoietic compartment. 2 months-old miR-22F/+;Mx1-Cre mice or Mx1-Cre littermate controls were treated with pIpC for 2 weeks. 2 weeks after pIpC administration, KSL (c-KitposSca-1posLinneg) cells were sorted to evaluate the characteristics of miR-22 expressing hematopoietic stem/progenitor cells. LTC-IC, long-term culture initiating cells, BMT, bone marrow transplantation. (D) Colony forming capacity of miR-22 expressing progenitor cells. 2 weeks after pIpC administration, sorted KSL cells from miR-22F/+;Mx1-Cre mice or littermate controls were cultured in semi-solid medium. Counting and classification of colonies were performed in independent littermate pairs (n=3). GEMM, Colony-forming unit-granulocyte, erythroid, macrophage, megakaryocyte, GM, Colony-forming unit-granulocyte, macrophage, M, Colony-forming unit-macrophage, E, Burst-forming unit-erythroid. (E) miR-22 expression retains the ability to serially replate and generate colonies. In vitro colony replating assay was performed as shown in Figure S2D and colony counts in the indicated replatings were scored (n=3). N.D., non-detectable. (F) Ectopic expression of miR-22 results in an increase of HSPCs in in vitro long-term culture with stromal cells. KSL cells isolated as described in (C) were co-cultured with OP-9 stromal cells for 2 weeks. Maintained Linneg cells and KSL cells were evaluated (n=3). Representative flow cytometry data of Linneg and the KSL cells (left) are shown. Mean percentage ± S.D. of KSL cells in Linneg cells (middle) and mean absolute numbers ± S.D. of CD45posKSL cells (right) are also shown. (G) miR-22 increases the myeloid compartment. The percentages of CD45pos cells (left), CD11bpos cells (middle), or Gr-1pos cells (right) in total mononuclear cells (MNCs) were investigated 2 weeks after the co-culture with stromal cells from (F) (n=3). All error bars represent ± S.D. “see also Figures S1, S2A–S2D and S7”.
Figure 2
Figure 2. miR-22 leads to an enhanced repopulating capacity of hematopoietic stem progenitor cells in vivo
(A and B) Ly45.1 recipient mice were transplanted with the 1500 KSL cells from miR-22F/+;Mx1-Cre mice (n=15) or littermate controls (n=10) after pIpC administration together with 4×10⁵ Ly45.1/Ly45.2 competitor BM MNCs. Donor-derived chimerism in peripheral blood was analyzed 6 weeks after the transplantation. Representative flow data of the CD45.1/CD45.2 positivity (A) and the percentages of donor-derived cells in myeloid (CD11bpos and/or Gr-1pos) (B, left) and donor-derived myeloid cells in MNCs (B, right) of recipient mice are shown. (C–E) Donor contribution in hematopoiesis of recipient mice 9 weeks after the transplantation. Representative flow data of the CD45.1/CD45.2 positivity with the percentages of donor-derived CD45.1negCD45.2pos cells (C, left) are shown. Mean percentages ± S.D. of donor-derived cells in MNCs (C, right), myeloid cells (D), B cells (E, left) and T cells (E, right) are shown (n=10 for littermate controls and n=15 for miR-22F/+;Mx1-Cre). (F) c-Kitpos cells are observed in peripheral blood of recipient mice transplanted with KSL cells from miR-22F/+;Mx1-Cre mice. Representative flow cytometry data of c-Kit positivity in donor-derived cells (left) and the percentages of c-Kitpos cells in donor-derived cells (right) are shown. (n=10 for littermate controls and n=15 for miR-22F/+;Mx1-Cre). All error bars represent ± S.D. “see also Figures S2E, S2F and S7”.
Figure 3
Figure 3. miR-22 overexpression develops hematological syndromes
(A and B) miR-22 overexpression leads to human MDS-like phenotypes characterized by defective erythropoiesis (A) and cytopenia (B) in miR-22 transgenic mice. After pIpC administration, 1500 KSL cells from miR-22F/+;Mx1-Cre mice or littermate controls were transplanted into lethally irradiated Ly45.1 recipient mice with 4×10⁵ Ly45.1/Ly45.2 competitor BM MNCs (n=10 for littermate controls and n=15 for miR-22F/+;Mx1-Cre). 12 weeks after transplantation, peripheral blood of recipient mice was evaluated. Representative flow data of the Ter119/CD71 positivity (A, left), the percentages of R1 (Ter119negCD71pos) (A, middle) and R2 (Ter119posCD71pos) (A, right) are shown. White blood cell (WBC) (B, left) and platelet (Plt) counts (B, right) are also shown. (C and D) SplenomegaIy and myeloid infiltration into spleen were observed in recipient mice transplanted with KSL cells from miR-22F/+;Mx1-Cre mice. Representative images of spleens (C, left), spleen weight (n=3) (C, right), and representative flow data of the positivity of c-Kit and CD11b and/or Gr-1 in spleen (D) are shown. (E) miR-22 expression leads to a differentiation defect in erythroid compartment. Representative flow data of the CD71/Ter119 positivity in spleen are shown. All error bars indicate ± S.D. “see also Figures S2G–S2I”.
Figure 4
Figure 4. miR-22 transgenic mice develop primary hematological diseases
(A and B) miR-22 transgenic mice develop MDS-like hematological syndromes. Representative smears of peripheral blood of 8 months-old mice after pIpC administration are shown (A). Representative images of dysplastic erythroid cells (poikilocytosis, A; polychromasia, B-i arrowhead), dysplastic platelets (giant platelet, B-i arrow, B-vii), dysplastic neutrophils (hypersegmented neutrophils, B-ii-iv arrows; a pseudo-Pelger-Huet anomaly, B-v and vi) and dysplastic blasts (B-viii arrows) in miR-22 transgenic mice are also shown. Scale bars, 50 μm (A) and 10 μm (B). (C) c-Kitpos immature blasts are increased in miR-22 transgenic mice. Representative flow cytometry data (left) and mean percentages ± S.D. of c-Kitpos cells in Linneg compartment (right) are shown (n=3). (D) Disease free survival of miR-22F/+;Mx1-Cre mice (n=26) and littermate controls (n=13). (E and F) Representative lethal hematological syndromes observed in miR-22 transgenic mice. Representative images of spleens (E, left) and H&E staining (E, right) are shown. Scale bars, 100 μm. Representative smears of peripheral blood of miR-22 transgenic mice (6 months old) with increased myeloid blasts (F) are also shown. Scale bars, 20 μm. (G) Pie charts representing the disease spectrum in miR-22F/+;Mx1-Cre mice at the indicated ages (n=26). MPN, myeloproliferative neoplasm. All error bars indicate ± S.D. “see also Figure S3”.
Figure 5
Figure 5. miR-22 acts as an epigenetic modifier by directly targeting TET2
(A and B) A reduction in the levels of Tet2 mRNA in miR-22 transgenic mice. Expression levels of miR-22 (left) and Tet2 mRNA (right) in mononuclear cells from peripheral blood (A) and bone marrow (BM) (B) of Mx1-Cre control or miR-22F/+;Mx1-Cre mice 2–3 weeks after pIpC administration were determined by real-time qPCR (n=6). (C) miR-22 expression results in a significant reduction in the levels of 5-hmC in hematopoietic compartment. 5-hmC and 5-mC were evaluated by immunofluorescence analysis in BM cells isolated from miR-22F/+;Mx1-Cre mice and littermate controls 3 weeks after pIpC administration (left). Cells expressing high levels of 5-hmC show low levels of 5-mC (arrow) and conversely, cells expressing low levels of 5-hmC exhibit high levels of 5-mC (arrowhead). Bar graph depicts mean percentages ± S.D. of cells expressing high levels of 5-hmC (n=3) (right). Scale bars, 10 μm. (D) miR-22 expression leads to a significant reduction in global 5-hmC expression levels in the genome in BM cells. 5-hmC levels were analyzed by quantitative dot blot assay with genomic DNA purified from BM cells of miR-22F/+;Mx1-Cre or littermate control mice. (E) Plots depict relative expression levels of putative Tet2 target genes (Aim2, Sp140, Igbt2 and Hal) in CD150posCD48negFlt-3negCD34negKSL cells of miR-22F/+;Mx1-Cre mice and littermate controls 2~3 weeks after pIpC administration (n=4). Ly6c1 and Actb were used as a Tet2 unrelated gene control and an internal control, respectively. (F and G) Repression of putative downstream genes of Tet2 in miR-22 transgenic mice. Expression levels of Tet2, Sp140 and Aim2 mRNAs (F) or proteins (G) in BM of miR-22F/+;Mx1-Cre mice or littermate controls 2–3 weeks after pIpC administration were evaluated (n=3). All error bars indicate ± S.D. “see also Figures S4A–S4F”.
Figure 6
Figure 6. miR-22–TET2 regulatory network affects hematopoietic stem cell function and hematological transformation
(A and B) Ectopic expression of TET2 reduces the colony forming capacity of miR-22 expressing hematopoietic stem/progenitor cells. The sorted KSL cells from miR-22F/+ mice were infected with Cre-GFP or GFP control vector. GFP+KSL cells were resorted and infected with empty vector or TET2 expressing lentiviral particles. Cells were then incubated in semi-solid medium. Colony replating assay was performed and the resulting colonies were counted at the indicated replatings (n=3) (A). Some of TET2 infected cells were also subjected to LTC-IC assay. Representative flow cytometry data of the positivity of c-Kit/Sca-1 in LinnegCD45pos gated cells 2 weeks after co-culture with stromal cells and mean percentages ± S.D. of KSL cells in Linneg CD45pos (in brackets) are shown (n=3) (B, left). Colony forming capacities were also determined at the indicated weeks after co-culture with stromal cells (n=3) (B, right). (C) TET2 attenuates the hematopoietic malignancies induced by miR-22 overexpression. KSL cells sorted from miR-22F/+ mice were infected with Cre-GFP or GFP control vector followed by TET2 infection, and 1500 GFP+KSL cells were transplanted into recipient mice with 2.0×10⁵ Ly45.1 competitor bone marrow mononuclear cells (BM MNCs). Disease free survival of recipient mice was examined by Kaplan-Meier survival curves. Log-rank test was used to generate P-value. (D) Overview of the experimental design for introduction of TET2 into KSL cells from miR-22 transgenic mice. KSL cells purified from miR-22 transgenic mice were subjected to infection with TET2 expressing vector, and their characteristics were evaluated in vivo and in vitro. (E) Colony forming capacity of miR-22 transgenic progenitor cells is attenuated by ectopic expression of TET2. 2 weeks after pIpC administration, sorted KSL cells from miR-22F/+;Mx1-Cre mice were infected with TET2 expressing vector and resorted KSL cells were then subjected to the incubation in semi-solid medium. The resulting colony numbers were scored in three independent littermate pairs in the indicated platings (n=3). N.D., non-detectable. (F and G) Ectopic expression of TET2 causes a reduction in LTC-IC capacity of miR-22 transgenic progenitor cells. TET2 infected KSL cells from miR-22F/+;Mx1-Cre mice or littermate controls, as shown in Figure 6D, were co-cultured with stromal cells for the indicated weeks. Maintained KSL cells were evaluated 2 weeks after co-culture (n=3) (F). At the indicated times after co-culture, the capacity of colony formation was also determined in semi-solid medium (n=3) (G). (H) Increased reconstitution capacity of KSL cells of miR-22 transgenic mice is reduced by ectopic expression of TET2. The sorted KSL cells from miR-22F/+;Mx1-Cre mice or littermate controls were infected with TET2 expressing vector. 1×10⁴ KSL cells were resorted and subjected to the bone marrow transplantation with 5×10⁵ competitor BM MNCs. Representative flow cytometry data of the CD45.1/CD45.2 positivity at 6 weeks after transplantation are shown. (I) Inhibition of miR-22 increases the expression of TET2 and its putative target genes in human leukemic cells. K562 cells were infected with the vector encoding miR-22 sponge or control sponge, and 48 hrs after the infection cell lysates were subjected to immunoblot analysis for the indicated proteins. (J) Inhibition of miR-22 suppresses the proliferation of human leukemic cells. K562 cells were infected with the vector encoding miR-22 sponge or control sponge. 48 hrs after puromycin selection, 5×10⁴ cells were incubated for 7 days. Optical densities of the cells were determined at the indicated times (n=3). All error bars indicate ± S.D. “see also Figures S4G–S4K and S5”.
Figure 7
Figure 7. miR-22 overexpression directly correlates with the silencing of TET2 in human MDS and AML patients
(A) TET2 expression is downregulated in human MDS patients. Expression levels of TET2 protein in CD34pos blasts in subtypes of MDS were evaluated by immunohistochemical analysis. Representative images of immunohistochemical analysis for TET2 protein in patients with subtypes of MDS are shown (left). Insets represent TET2 staining in blasts (arrow with B) with a high magnification. Scoring the expression levels of TET2 in blasts was performed as described in Extended Experimental Procedures (right). The data were analyzed by Chi-square test. r, Pearson’s r. Scale bars, 60 μm. (B) Downregulation of TET2 levels correlates with poor survival rates of human MDS patients. Overall survival of patients that express low TET2 (TET2 Score 1, n=38, red) or high TET2 (TET2 Score 2 or 3, n=69, blue) is shown. P-value is generated by log-rank test. (C) Survival rates of low TET2 (Score 1) and high TET2 (Score 2 or 3) patients with RA (left), RAEB-1 (middle) and RAEB-2 (right). Survival rate of P-value is generated by log-rank test. (D) miR-22 overexpression correlates with downregulation of TET2 in MDS patients. 107 MDS patient specimen were subjected to in situ hybridization and immunohistochemical analyses, and the expression levels of miR-22 and TET2 were evaluated. The data were analyzed by Chi-square test. r, Pearson’s r. (E) The expression levels of miR-22 and TET2 in 18 AML with MLD patient samples were evaluated. The data were analyzed by Chi-square test. r, Pearson’s r. AML, acute myeloid leukemia; MLD, multiple lineage dysplasia. (F) miR-22 is highly expressed in human AML patients. Expression levels of miR-22 in CD34pos bone marrow cells from healthy donors (n=9) and AML patients (n=215) are shown. (G) Proposed model of oncogenic role of miR-22 in hematopoiesis. miR-22 negatively regulates TET2 tumor suppressor, leading to a reduction of 5-hmC and a potentiation of global gene methylation. This genetic remodeling in turn enhances hematopoietic stem cell function and promotes hematological transformation. HSCs, hematopoietic stem cells, LIC, leukemia-initiating cells. “see also Figure S6”.

Comment in

References

    1. Abdel-Wahab O, Manshouri T, Patel J, Harris K, Yao J, Hedvat C, Heguy A, Bueso-Ramos C, Kantarjian H, Levine RL, et al. Genetic analysis of transforming events that convert chronic myeloproliferative neoplasms to leukemias. Cancer Res. 2010;70:447–452. - PMC - PubMed
    1. Abdel-Wahab O, Mullally A, Hedvat C, Garcia-Manero G, Patel J, Wadleigh M, Malinge S, Yao J, Kilpivaara O, Bhat R, et al. Genetic characterization of TET1, TET2, and TET3 alterations in myeloid malignancies. Blood. 2009;114:144–147. - PMC - PubMed
    1. Arnold CP, Tan R, Zhou B, Yue SB, Schaffert S, Biggs JR, Doyonnas R, Lo MC, Perry JM, Renault VM, et al. MicroRNA programs in normal and aberrant stem and progenitor cells. Genome Res. 2011;21:798–810. - PMC - PubMed
    1. Bartel DP. MicroRNAs: genomics, biogenesis, mechanism, and function. Cell. 2004;116:281–297. - PubMed
    1. Berger AH, Knudson AG, Pandolfi PP. A continuum model for tumour suppression. Nature. 2011;476:163–169. - PMC - PubMed

Publication types

MeSH terms