. 2013 Jul 3;13(1):102-16.
doi: 10.1016/j.stem.2013.05.014.

SLAM family markers resolve functionally distinct subpopulations of hematopoietic stem cells and multipotent progenitors

Affiliations

SLAM family markers resolve functionally distinct subpopulations of hematopoietic stem cells and multipotent progenitors

Hideyuki Oguro et al. Cell Stem Cell. .

Abstract

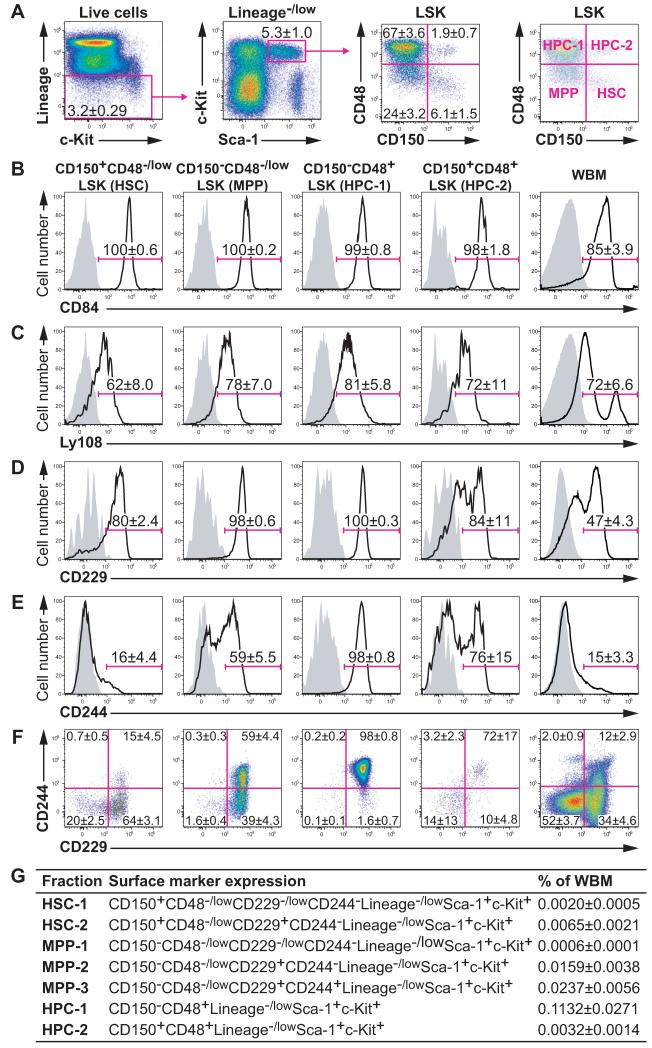
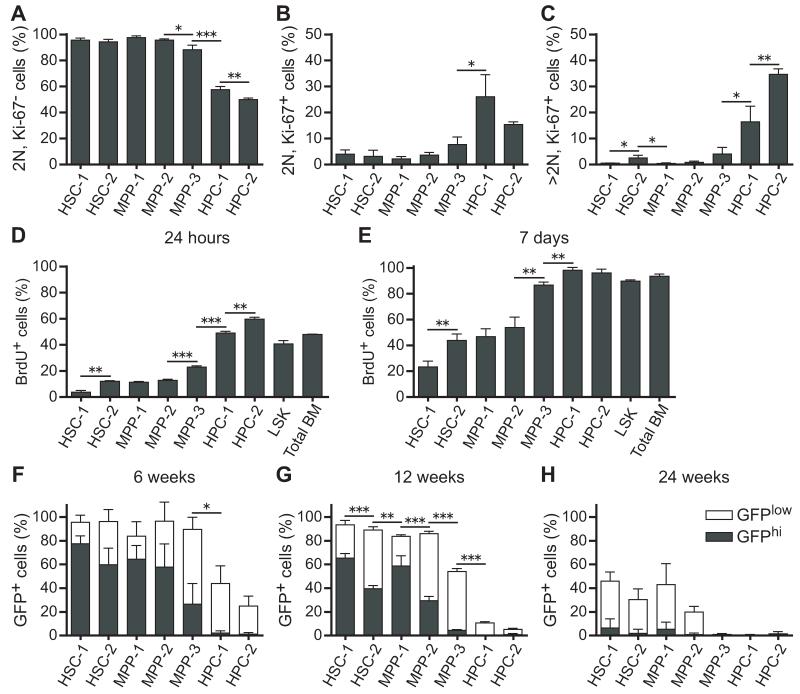
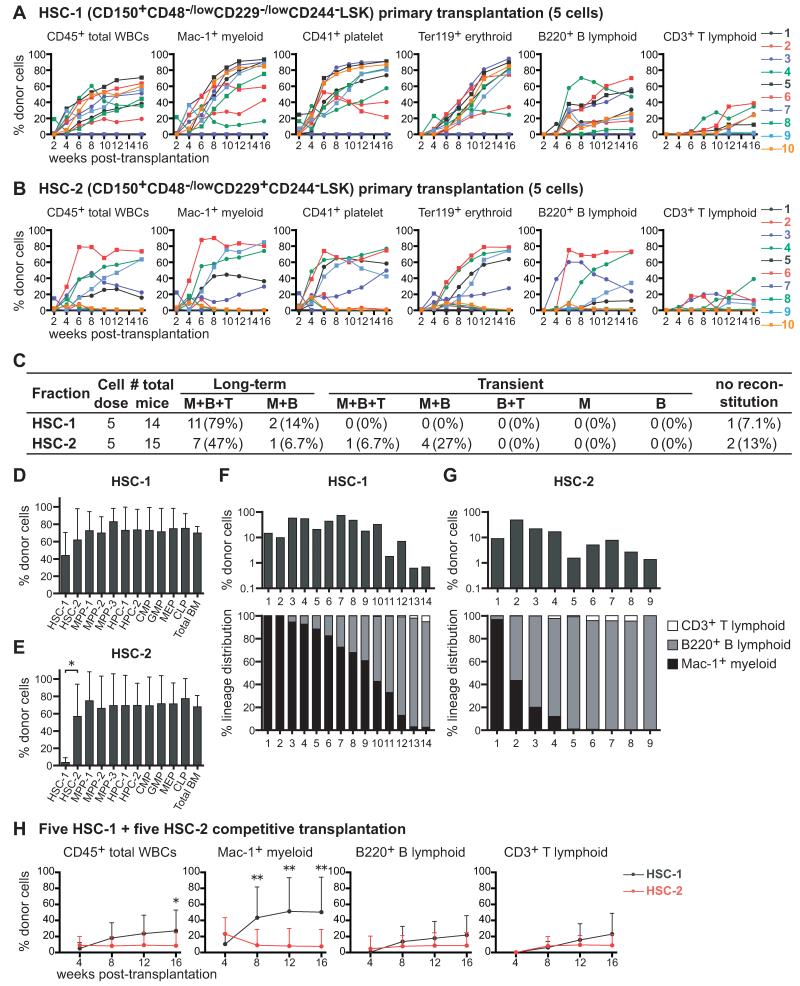
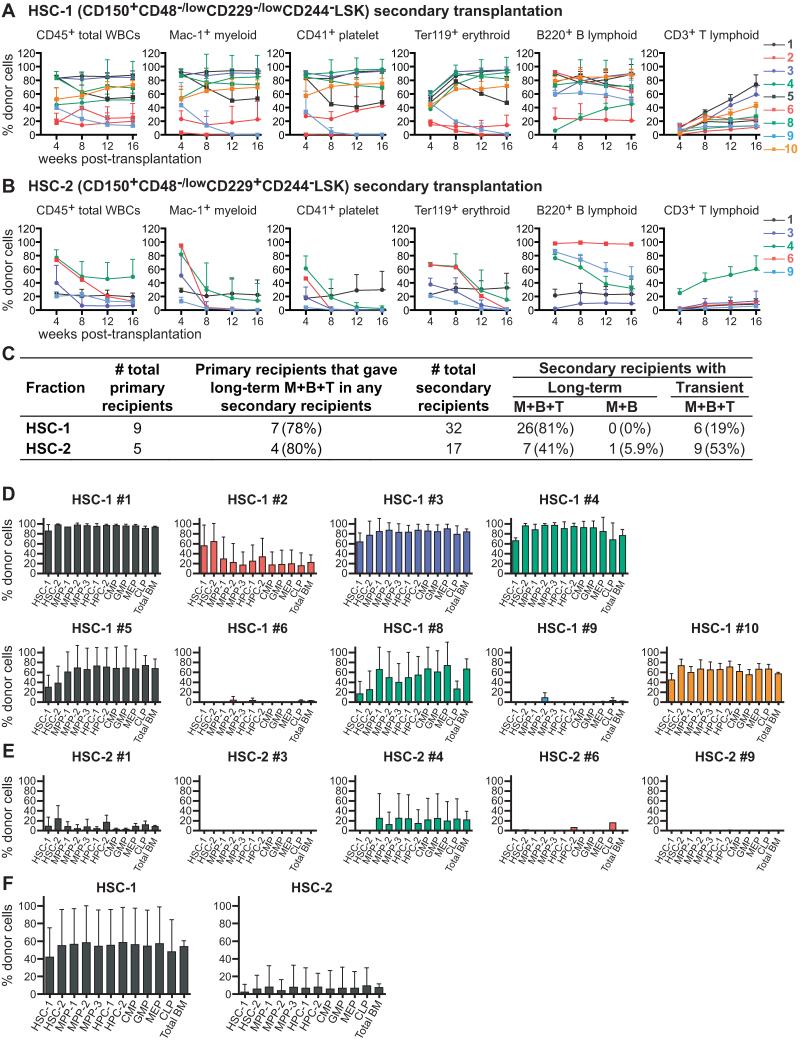
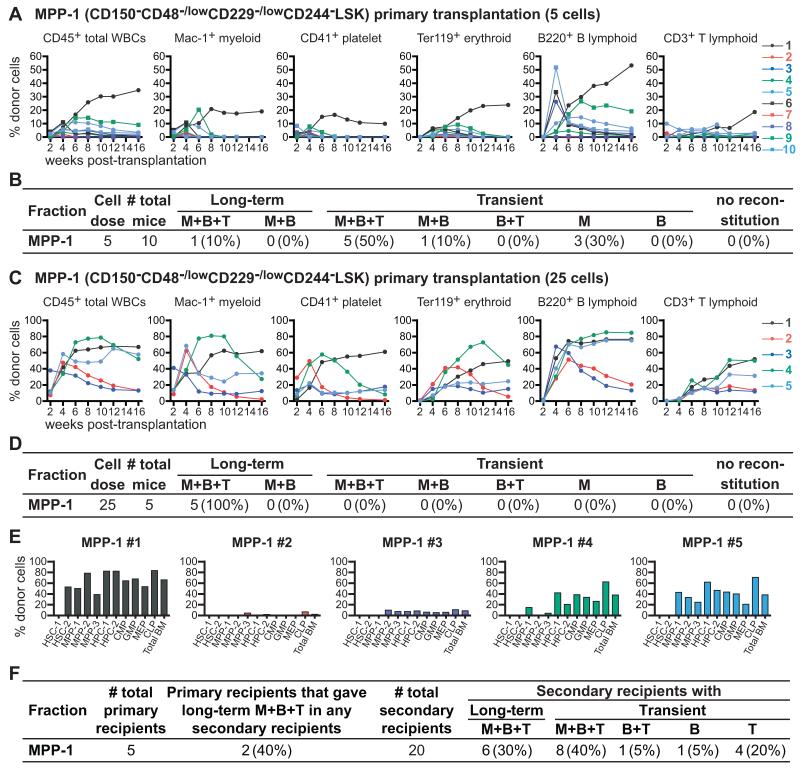
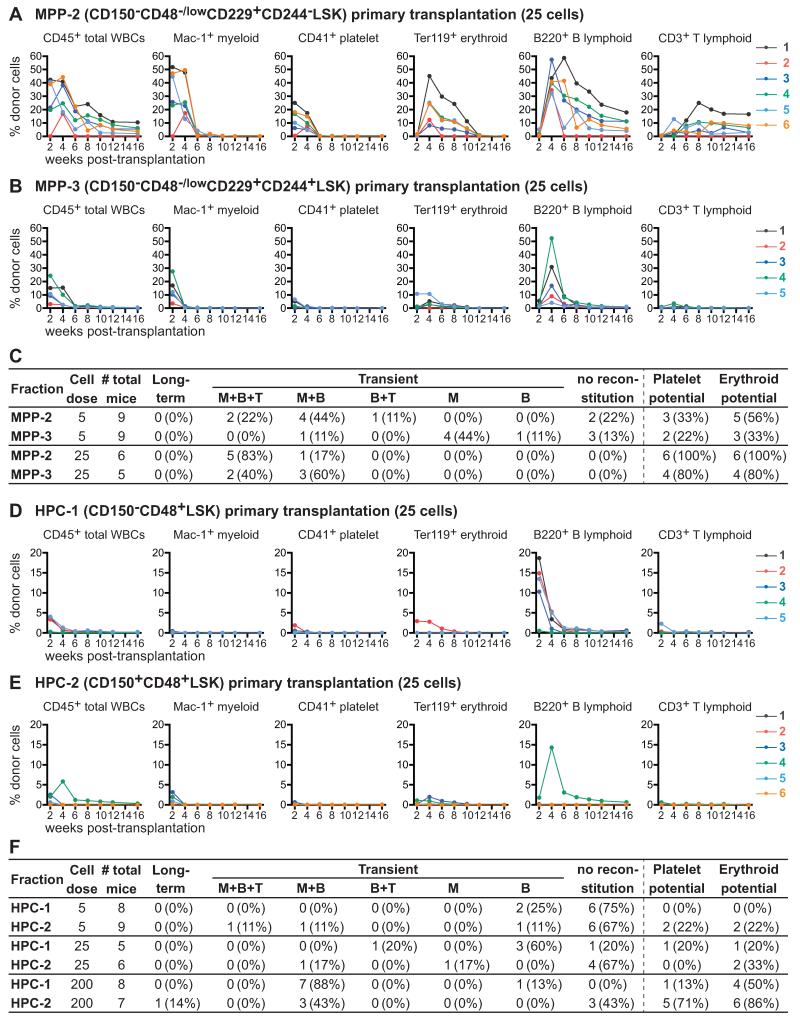
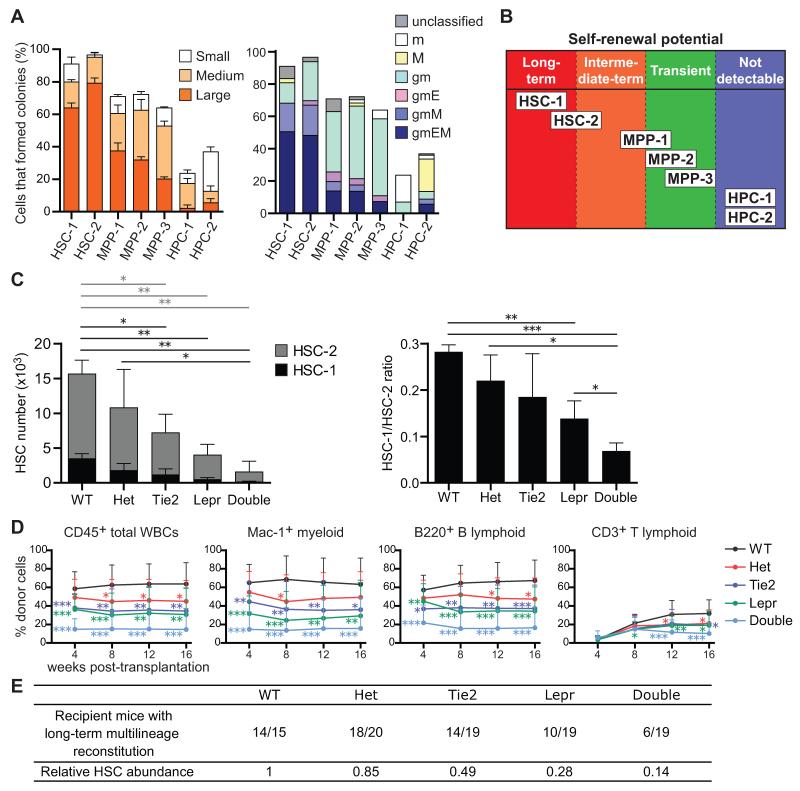
Hematopoietic stem cells (HSCs) and multipotent hematopoietic progenitors (MPPs) are routinely isolated using various markers but remain heterogeneous. Here we show that four SLAM family markers, CD150, CD48, CD229, and CD244, can distinguish HSCs and MPPs from restricted progenitors and subdivide them into a hierarchy of functionally distinct subpopulations with stepwise changes in cell-cycle status, self-renewal, and reconstituting potential. CD229 expression largely distinguished lymphoid-biased HSCs from rarely dividing myeloid-biased HSCs, enabling prospective enrichment of these HSC subsets. Differences in CD229 and CD244 expression resolved CD150(-)CD48(-/low)Lineage(-/low)Sca-1(+)c-Kit(+) cells into a hierarchy of highly purified MPPs that retained erythroid and platelet potential but exhibited progressive changes in mitotic activity and reconstituting potential. Use of these markers, and reconstitution assays, showed that conditional deletion of Scf from endothelial cells and perivascular stromal cells eliminated the vast majority of bone marrow HSCs, including nearly all CD229(-/low) HSCs, demonstrating that quiescent HSCs are maintained by a perivascular niche.


Figures

Figure 1
Figure 1. Expression of the SLAM family markers CD84, Ly108, CD229, and CD244 by LSK hematopoietic stem and progenitor cells
(A) Gating strategy for LSK cells (left and middle left panels) and expression of CD150 and CD48 by LSK cells (middle right panel). The CD150+CD48−/lowLSK, CD150CD48−/lowLSK, CD150CD48+LSK, and CD150+CD48+LSK fractions were labeled as HSC, MPP, HPC-1, and HPC-2, respectively (right panel). Doublets, red blood cells, and dead cells were excluded prior to analysis. (B-E) Cell surface staining for CD84/Slamf5 (B), Ly108/Slamf6 (C), CD229/Slamf3 (D), and CD244/Slamf4 (E). Solid lines indicate staining with antibodies against the indicated antigens and shaded areas indicate background fluorescence in controls stained with all antibodies except for the indicated antigen. (F) Flow cytometry plots showing combined CD229 and CD244 staining in each cell fraction. (G) Summary of LSK stem and progenitor cell fractions subdivided according to CD229 and CD244 staining. Data represent mean ± S.D. from 3 (B and C) or 11 independent experiments (A, D-G). See also Figures S1 and S2.
Figure 2
Figure 2. Cell cycle status of each hematopoietic stem and progenitor cell fraction
(A-C) The frequency of cells in G0 (A; Ki-67, 2N DNA content), G1 (B; Ki-67+, 2N DNA content), and S/G2/M (C; Ki-67+, >2N DNA content) phases of the cell cycle. (D and E) The frequency of BrdU+ cells in each fraction after 24 hours (D) or 7 days (E) of BrdU administration. (F-H) Expression of histone H2B-GFP was induced in hematopoietic cells by doxycycline administration for 6 weeks then chased for 6 weeks (F), 12 weeks (G), or 24 weeks (H) without doxycycline to monitor the rate of H2B-GFP dilution. Filled and open bars represent the proportion of GFPhi and GFPlo cells, respectively, in each population. The gating scheme used to identify GFPhi and GFPlo cells is shown in Figure S2. Data represent mean ± S.D. from 2 independent experiments with a total of 4 mice (F and G) or 3 independent experiments with a total of 7 mice (A-E, H). *p<0.05; **p<0.01; ***p<0.001 by Student’s t-test. Statistical analyses in F-H compared only the frequency of GFPhi cells among cell populations. See also Figure S3.
Figure 3
Figure 3. The HSC-1 and HSC-2 populations form a hierarchy of long-term multilineage reconstituting cells
(A and B) Long-term competitive reconstitution assay in which 5 GFP+ donor cells from the HSC-1 (A) or HSC-2 (B) population were transplanted into irradiated recipient mice along with 200,000 recipient bone marrow cells. Each line represents the frequency of donor-derived cells in the blood of a single recipient. (C) Summary of the results from the primary transplants in panels A and B. Recipients were considered long-term reconstituted if donor myeloid cells were more than 1% of blood cells for at least 16 weeks after transplantation. M, Mac-1+ myeloid cells; B, B220+ B cells; T, CD3+ T cells. (D and E) The frequencies of donor-derived hematopoietic stem/progenitor cells in the bone marrow of mice that were long-term reconstituted by 5 HSC-1 (D) or 5 HSC-2 (E) cells at 17 to 25 weeks after primary transplantation. (F and G) Clonal analysis of HSC-1 and HSC-2 cells. Single GFP+ HSC-1 (F) or HSC-2 (G) cells were transplanted into 30 irradiated recipient mice per population along with 200,000 recipient bone marrow cells. Some of these mice were long-term multilineage reconstituted and some were transiently multilineage reconstituted. (H) Long-term competitive reconstitution assay in which 5 CD45.1+ HSC-1 cells and 5 CD45.2+ HSC-2 cells were transplanted into irradiated CD45.1+CD45.2+ recipient mice along with 200,000 CD45.1+CD45.2+ bone marrow cells. Data represent mean ± S.D. from one experiment with a total of 13 recipient mice per treatment. Data in other panels are from 2 (A, B, D, E) or 3 (C, G) independent experiments. *p<0.05; **p<0.01 by student t-test. See also Figure S4.
Figure 4
Figure 4. Serial transplantation reveals that HSC-1 cells have more self-renewal potential than HSC-2 cells
(A and B) Five million bone marrow cells from primary recipients that were long-term reconstituted by 5 HSC-1 (A) or 5 HSC-2 (B) cells were transplanted into secondary recipient mice. The secondary recipient mice were assigned numbers that corresponded to the numbers of the primary recipient mice shown in Figures 3A and 3B. For example, the mean ± S.D. for the frequency of donor blood cells in secondary recipients of cells from primary recipient #1 in Figure 3A is shown as line #1 in Figure 4A. Data are from two independent experiments with 3-4 secondary recipients per primary donor. (C) Summary of secondary transplantation results from panels A and B. (D and E) The frequencies of donor-derived hematopoietic stem/progenitor cells in the bone marrow of secondary recipient mice 17-25 weeks after transplantation. As in panels A and B, the secondary recipient mice are numbered according to the primary recipient from which they received cells. Data are mean ± S.D. from 3-4 secondary recipient mice per primary recipient. (F) The frequencies of donor-derived hematopoietic stem/progenitor cells in all secondary recipients of HSC-1 (mean ± S.D. from the data in Figure 4D, n=32 secondary recipients total) and HSC-2 (mean ± S.D. from the data in Figure 4E, n=17 secondary recipients total) cells.
Figure 5
Figure 5. MPP-1 cells contain a mixture of long-term and transiently reconstituting multipotent progenitors
(A) Five GFP+CD45.2+ donor cells were transplanted into irradiated CD45.1+ recipient mice along with 200,000 CD45.1+ recipient bone marrow cells. Each line represents the frequency of donor-derived blood cells in a single recipient mouse. (B) Summary of the primary transplantation results from Figure 5A. (C) Twenty-five GFP+CD45.2+ donor cells were competitively transplanted into irradiated CD45.1+ recipient mice. (D) Summary of the results in Figure 5C. (E) The frequencies of donor-derived hematopoietic stem/progenitor cells in the bone marrow of mice reconstituted by 25 MPP-1 cells, at 17 weeks after transplantation. (F) Summary of secondary transplantation experiments. Five million bone marrow cells from primary recipients of 25 MPP-1 cells were transplanted into four secondary recipient mice per primary recipient mouse.
Figure 6
Figure 6. MPP-2 and MPP-3 cells are transiently reconstituting multipotent progenitors while HPC-1 and HPC-2 cells contain a heterogeneous mix of restricted progenitors
(A and B) Twenty-five GFP+CD45.2+ MPP-2 (A) or MPP-3 (B) donor cells were transplanted into irradiated CD45.1+ recipient mice along with 200,000 CD45.1+ recipient bone marrow cells. Each line represents the frequency of donor-derived blood cells in a single recipient. (C) Summary of the reconstitution results from Figure 6A and B. (D and E) Twenty-five GFP+CD45.2+ HPC-1 (D) or HPC-2 (E) donor cells were transplanted into irradiated CD45.1+ recipient mice along with 200,000 CD45.1+ recipient bone marrow cells. Each line represents the frequency of donor-derived blood cells in a single recipient. (F) Summary of the reconstitution results from Figure 6D and E. See also Figures S5 and S6.
Figure 7
Figure 7. Quiescent HSC-1 cells are maintained by a perivascular niche in which Scf is expressed by endothelial and perivascular stromal cells
(A) Colony formation assay. Forty-eight cells from each HSC, MPP, and HPC fraction were sorted, one cell per well. Large (>2 mm in diameter), medium (>1 mm in diameter), and small (<1 mm in diameter) colonies were counted (left panel, mean ± S.D.) and their composition assessed by Giemsa staining after 14 days of culture (right panel, mean ± S.D.). g, granulocyte; m, macrophage; E, erythroblasts; M, megakaryocyte. Data represent 6 independent experiments. (B) Schematic summarizing the self-renewal potentials of each fraction of hematopoietic stem/progenitor cells distinguished using SLAM family markers. (C) The number of HSC-1 and HSC-2 cells in femurs and tibias from 5-10 month old adult wild-type (WT), Scf fl/− (Het), Tie2-cre; Scffl/− (Tie2), Lepr-cre; Scffl/− (Lepr), and Tie2-cre; Lepr-cre; Scffl/− (Double) mice (left panel). Statistical significance was separately analyzed for HSC-1 cells (black bars) and HSC-2 cells (gray bars). The ratio of HSC-1 to HSC-2 cells (right panel). Data represent mean ± S.D. from 3 independent experiments. (D) 300,000 donor bone marrow cells from each genetic background were transplanted into irradiated recipient mice along with 300,000 recipient bone marrow cells. Data represent mean ± S.D. from 4 independent experiments with a total of 15-20 recipient mice per genotype. (E) Summary of reconstitution results from panel D. Recipient mice were considered long-term multilineage reconstituted if donor myeloid, B, and T cells represented more than 1% of blood cells in each lineage 16 weeks after transplantation. *p<0.05, **p<0.01, ***p<0.001 by student’s t-test. See also Figure S7.

Similar articles

Cited by

References

    1. Adolfsson J, Mansson R, Buza-Vidas N, Hultquist A, Liuba K, Jensen CT, Bryder D, Yang L, Borge OJ, Thoren LA, et al. Identification of Flt3+ lympho-myeloid stem cells lacking erythro-megakaryocytic potential a revised road map for adult blood lineage commitment. Cell. 2005;121:295–306. - PubMed
    1. Balazs AB, Fabian AJ, Esmon CT, Mulligan RC. Endothelial protein C receptor (CD201) explicitly identifies hematopoietic stem cells in murine bone marrow. Blood. 2006;107:2317–2321. - PMC - PubMed
    1. Beerman I, Bhattacharya D, Zandi S, Sigvardsson M, Weissman IL, Bryder D, Rossi DJ. Functionally distinct hematopoietic stem cells modulate hematopoietic lineage potential during aging by a mechanism of clonal expansion. Proc. Nat. Acad. Sci. USA. 2010;107:5465–5470. - PMC - PubMed
    1. Benveniste P, Frelin C, Janmohamed S, Barbara M, Herrington R, Hyam D, Iscove NN. Intermediate-term hematopoietic stem cells with extended but time-limited reconstitution potential. Cell Stem Cell. 2010;6:48–58. - PubMed
    1. Boyer SW, Schroeder AV, Smith-Berdan S, Forsberg EC. All hematopoietic cells develop from hematopoietic stem cells through Flk2/Flt3-positive progenitor cells. Cell Stem Cell. 2011;9:64–73. - PMC - PubMed

Publication types

MeSH terms