. 2013 Sep;41(16):e154.
doi: 10.1093/nar/gkt551. Epub 2013 Jul 4.

MiST: a new approach to variant detection in deep sequencing datasets

Affiliations

MiST: a new approach to variant detection in deep sequencing datasets

Sailakshmi Subramanian et al. Nucleic Acids Res. 2013 Sep.

Abstract

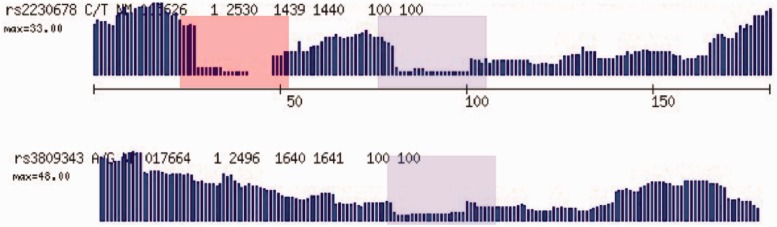
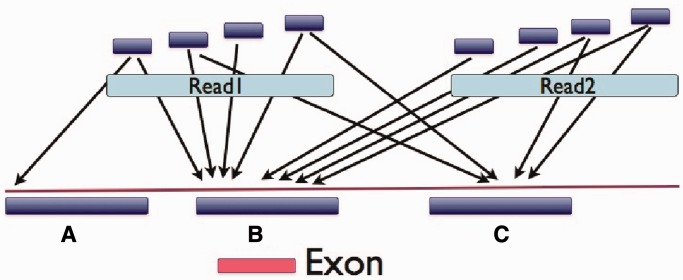
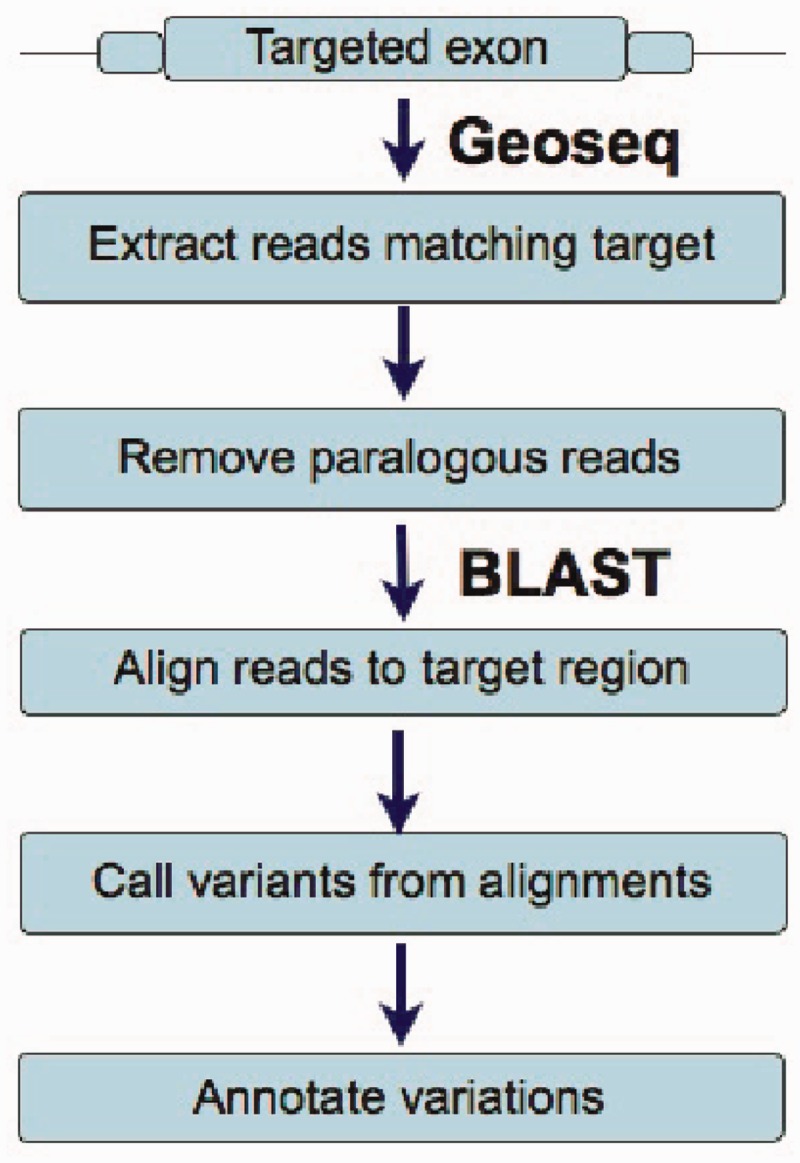
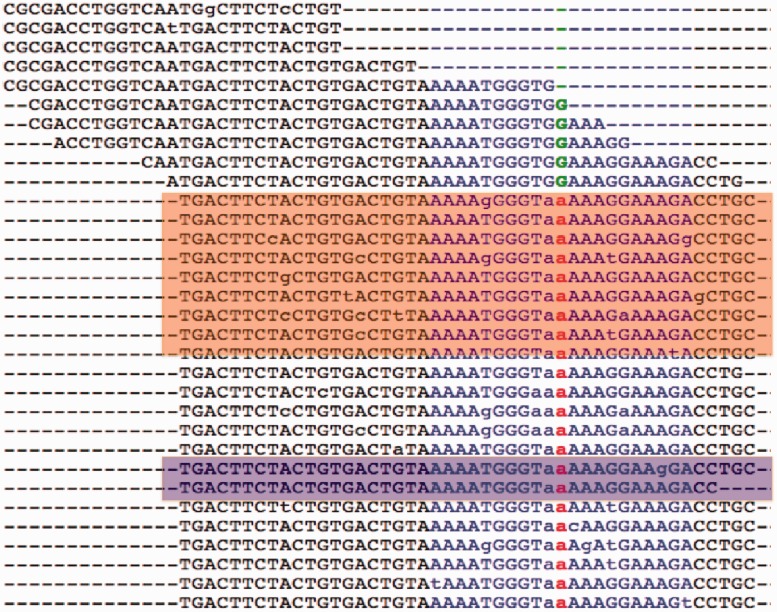
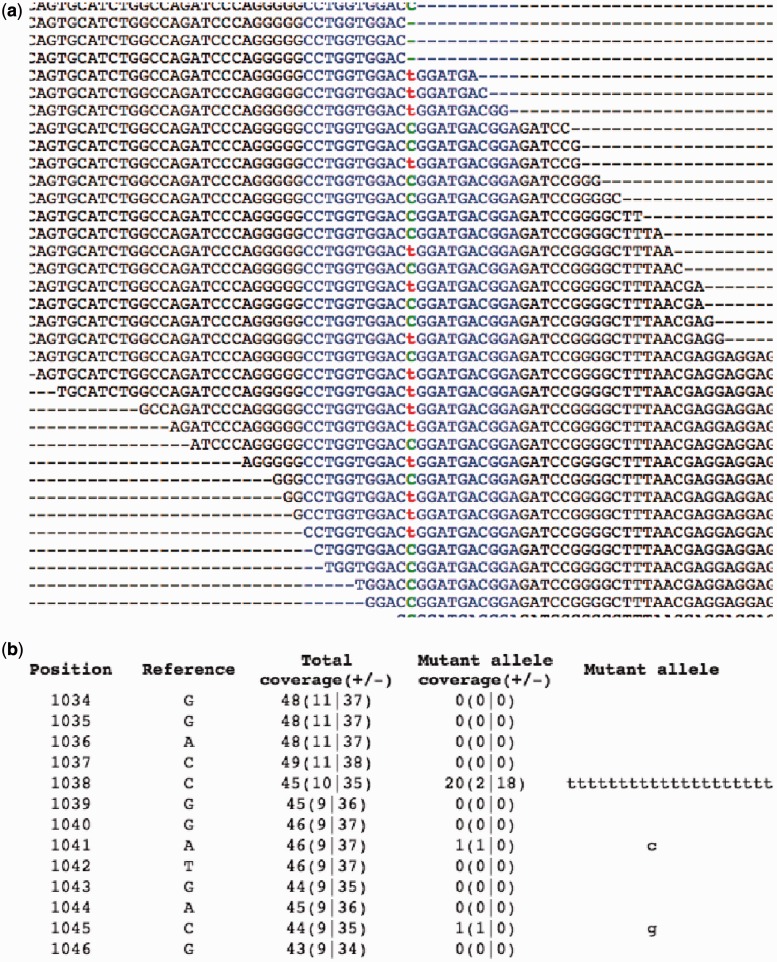
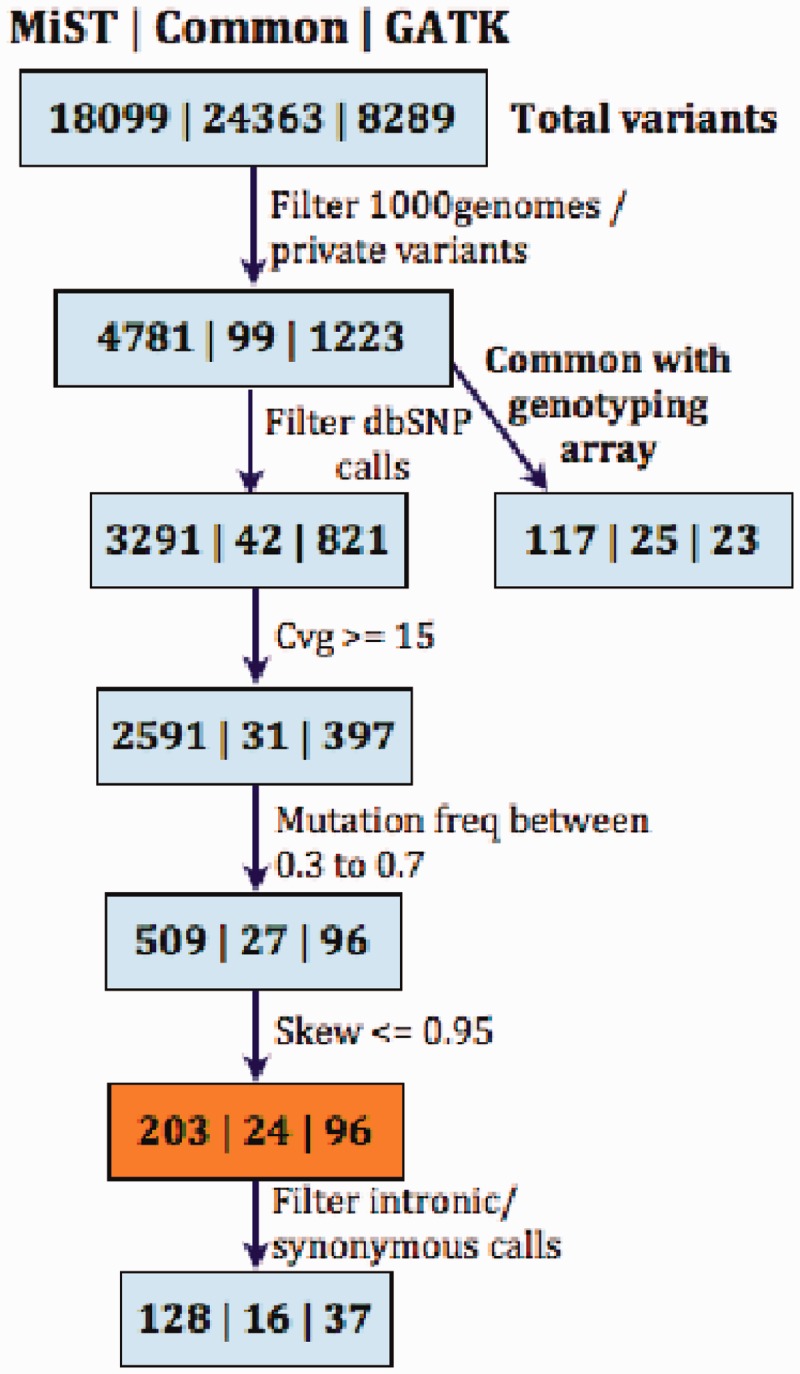
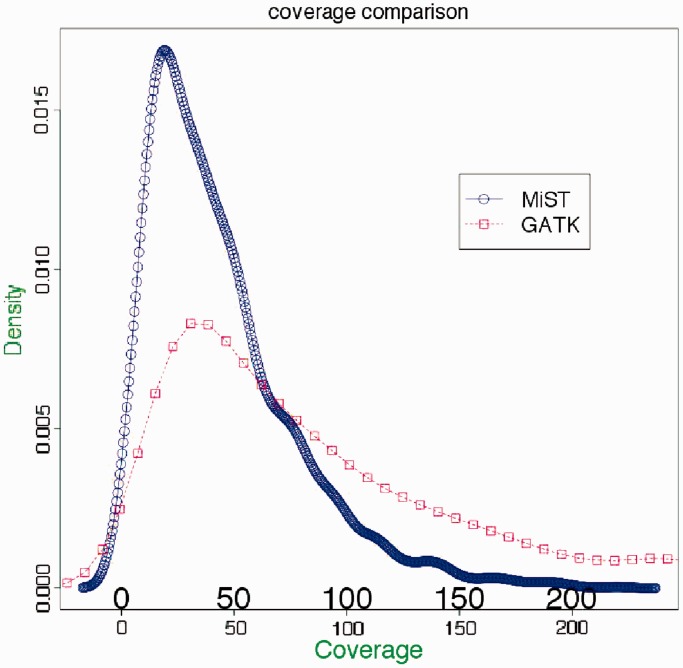
MiST is a novel approach to variant calling from deep sequencing data, using the inverted mapping approach developed for Geoseq. Reads that can map to a targeted exonic region are identified using exact matches to tiles from the region. The reads are then aligned to the targets to discover variants. MiST carefully handles paralogous reads that map ambiguously to the genome and clonal reads arising from PCR bias, which are the two major sources of errors in variant calling. The reduced computational complexity of mapping selected reads to targeted regions of the genome improves speed, specificity and sensitivity of variant detection. Compared with variant calls from the GATK platform, MiST showed better concordance with SNPs from dbSNP and genotypes determined by an exonic-SNP array. Variant calls made only by MiST confirm at a high rate (>90%) by Sanger sequencing. Thus, MiST is a valuable alternative tool to analyse variants in deep sequencing data.


Figures

Figure 1.
Figure 1.
Motivation for the use of Geoseq in variant calling. When exact matches of tiles from mRNAs in the sequenced reads are plotted, SNPs in the query sequence lead to gaps of the size of tiles in the matches. We see here examples of homozygous (top panel) and heterozygous (bottom panel) SNPs. This suggests that alignment of reads that map to the gaps can identify SNPs and indels.
Figure 2.
Figure 2.
Identification of potentially paralogous read pairs. Perfect matches are found in the genome for tiles from each read in a pair. A majority rule identifies the origin of the read pair. In this case region B is identified as the origin of the read-pair which includes the target exon shown below it. So, the read pair is selected for careful alignment to the target exonic region. This process can distinguish between pseudo-genes and their partner genes, as well as homologous genes since, for most exons, at least one member of the pair will extend into introns which evolve at a neutral rate and exhibit differences specific to their genomic location.
Figure 3.
Figure 3.
A schematic of the workflow used by MiST. The first step retrieves reads that can potentially match a targeted exonic region, and the following steps remove reads that can match other locations on the genome and align the reads to the exonic regions to call variants from the reference sequence.
Figure 4.
Figure 4.
Clonal reads arise from multiple sequencing of the same clone due to biased PCR amplification of the samples. Clonal reads are identified more reliably with paired-end sequencing. The orange box shows a set of clonal reads that map to the same stretch of the genome with a few mismatches within the reads. Even with poor sequencing quality, by requiring that at least three out of four ends of the pairs coincide, clonal reads are reliably identified. The violet box shows clonal reads with one varying end due to poor sequence quality. The corrected coverage of the variant shown in the figure (in red) is 8 (A-2/G-6), while the original coverage is 241 (A-201/G-40). Clonality causes a spurious increase in coverage, creating erroneous variant calls, and an overestimation of the quality of capture and sequencing.
Figure 5.
Figure 5.
Only MiST detected the variant in gene NLRC3, R282W (chr16:3614094 on hg19), which was confirmed by Sanger sequencing. (a) Alignment View and (b) Pileup View. In the pileup view, column 1 is the position relative to the start of the genomic fragment, column 2 is the reference allele, column 3 gives coverage at that position, with the number of reads in forward and reverse directions (±) shown within parenthesis, column 4 gives the coverage for the mutated allele and the non-reference allele in the reads are shown in column 5. The name of the file contains the position of the fragment in the genome. MiST calls this SNP despite a strong skew (strand-bias) in the mutant allele because the reference allele also shows a strong skew.
Figure 6.
Figure 6.
Comparison of MiST and GATK. Each box has three sets of numbers, from left to right they are variant calls, (i) unique to MiST, (ii) common to both platforms and (iii) unique to GATK. Filters are applied to remove calls occurring in public databases like dbSNP (17), 1000 Genomes (18) and a collection of already known private variants. MiST called 14 808 variants from dbSNP and 1000 genomes as opposed to 7468 variants by GATK. MiST had more variants in common with the exonic genotyping array, compared with GATK. In the box shaded orange, of the 96 calls unique to GATK, 25 calls map to multiple locations, 35 calls were far from exonic boundaries, 6 calls were eliminated by MiST for arising in low complexity regions such as a run of T’s, 14 calls were eliminated by MiST due to clonality corrections. In addition, there were 16 calls private to GATK (7 in UTRs, and 9 synonymous calls) that were not called by MiST, because the exons are not present in RefSeq.
Figure 7.
Figure 7.
A comparison of coverage between the MiST and GATK pipelines. The graph shows density distributions of coverage over variants that have been called by both platforms. The total area under each curve is 1. As seen from the graph, MiST has, on average, lower coverage per variant compared with GATK, due to more stringent removal of artifacts arising from clonal reads as well as reads that map to multiple locations.

References

    1. Clark MJ, Chen R, Lam HYK, Karczewski KJ, Chen R, Euskirchen G, Butte AJ, Snyder M. Performance comparison of exome DNA sequencing technologies. Nat. Biotechnol. 2011;29:908–914. - PMC - PubMed
    1. DePristo MA, Banks E, Poplin R, Garimella KV, Maguire JR, Hartl C, Philippakis AA, del Angel G, Rivas MA, Hanna M, et al. A framework for variation discovery and genotyping using next-generation DNA sequencing data. Nat. Genet. 2011;43:491–498. - PMC - PubMed
    1. McKenna A, Hanna M, Banks E, Sivachenko A, Cibulskis K, Kernytsky A, Garimella K, Altshuler D, Gabriel S, Daly M, et al. The genome analysis toolkit: a MapReduce framework for analyzing next-generation DNA sequencing data. Genome Res. 20:1297–1303. - PMC - PubMed
    1. Li H, Handsaker B, Wysoker A, Fennell T, Ruan J, Homer N, Marth G, Abecasis G, Durbin R. The sequence Alignment/Map format and SAMtools. Bioinformatics (Oxford, Engl.) 2009;25:2078–2079. - PMC - PubMed
    1. FreeBayes - the MarthLab. http://bioinformatics.bc.edu/marthlab/FreeBayes.

Publication types