

The impact of nitric oxide toxicity on the evolution of the glutathione transferase superfamily: a proposal for an evolutionary driving force
- PMID: 23828197
- PMCID: PMC3750189
- DOI: 10.1074/jbc.M113.476135
The impact of nitric oxide toxicity on the evolution of the glutathione transferase superfamily: a proposal for an evolutionary driving force
Abstract
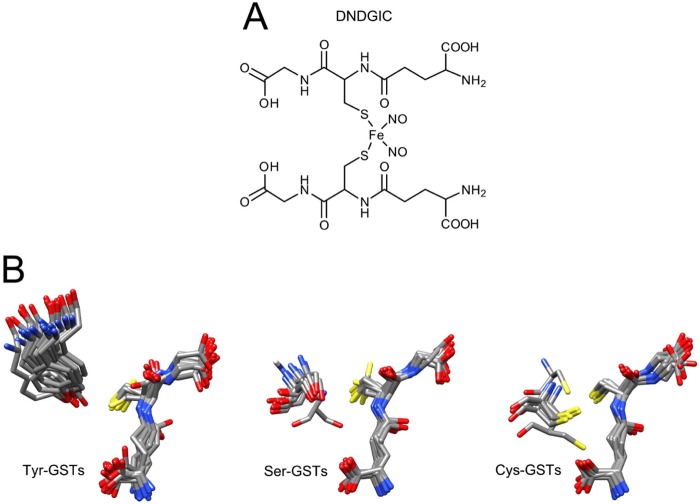
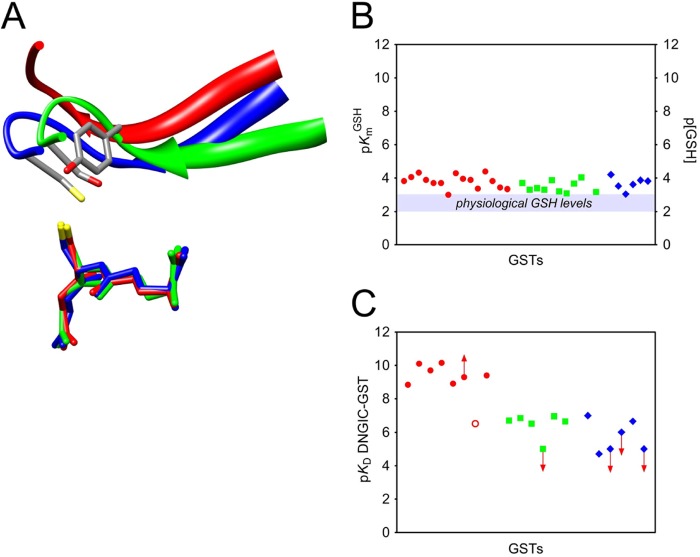
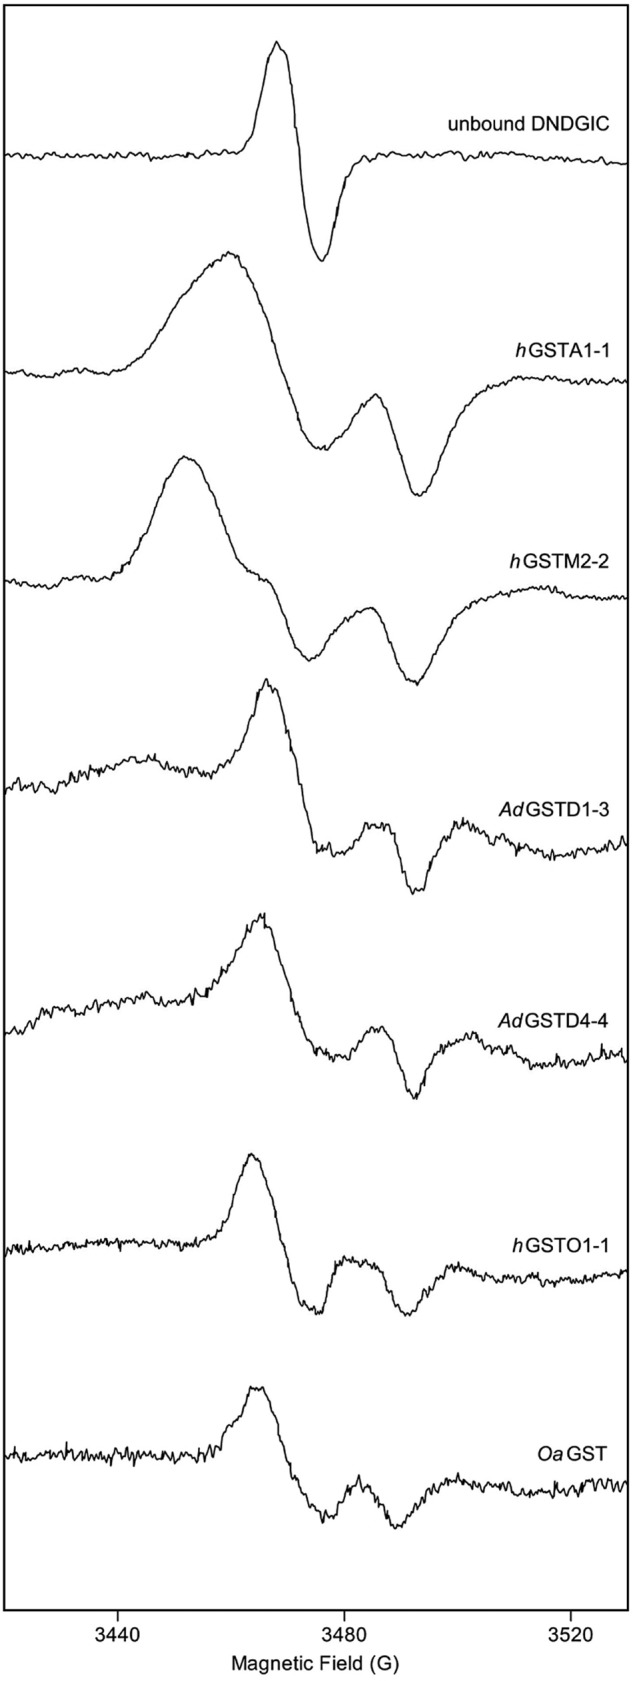
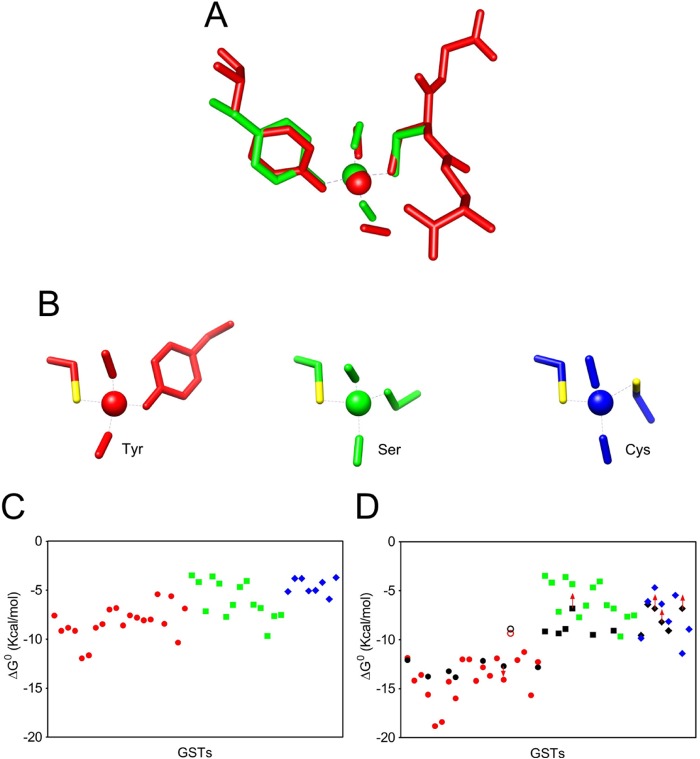
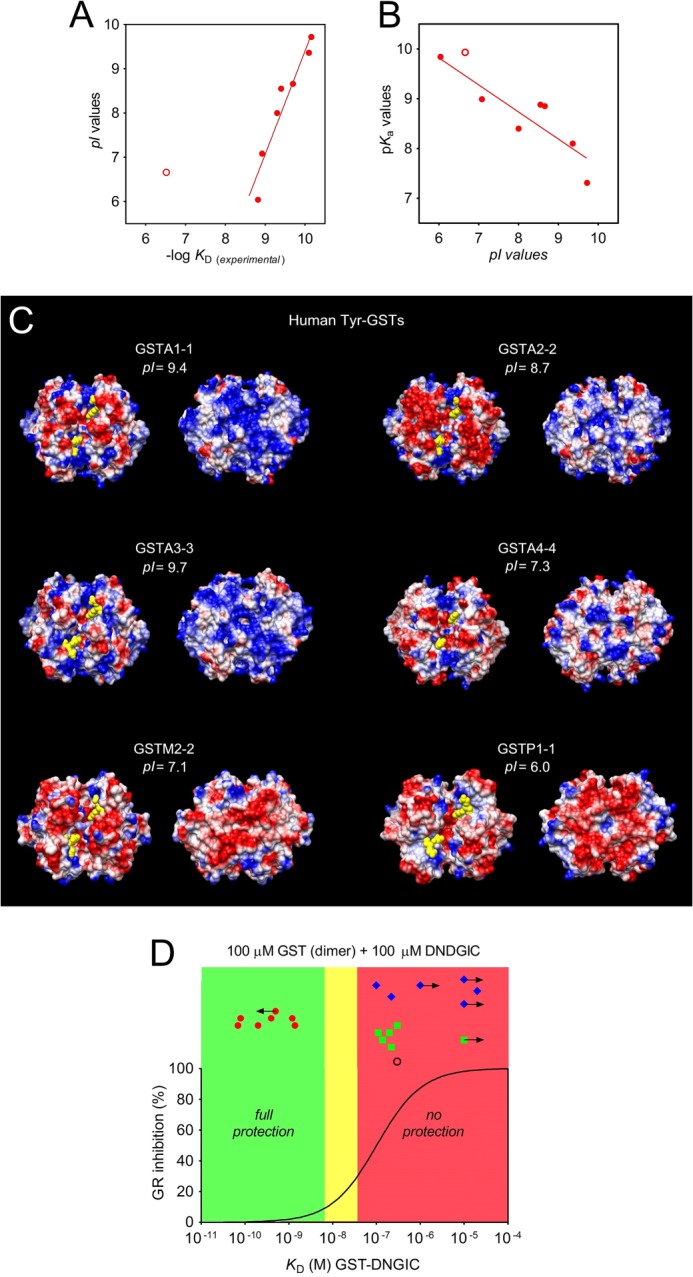
Glutathione transferases (GSTs) are protection enzymes capable of conjugating glutathione (GSH) to toxic compounds. During evolution an important catalytic cysteine residue involved in GSH activation was replaced by serine or, more recently, by tyrosine. The utility of these replacements represents an enigma because they yield no improvements in the affinity toward GSH or in its reactivity. Here we show that these changes better protect the cell from nitric oxide (NO) insults. In fact the dinitrosyl·diglutathionyl·iron complex (DNDGIC), which is formed spontaneously when NO enters the cell, is highly toxic when free in solution but completely harmless when bound to GSTs. By examining 42 different GSTs we discovered that only the more recently evolved Tyr-based GSTs display enough affinity for DNDGIC (KD < 10(-9) M) to sequester the complex efficiently. Ser-based GSTs and Cys-based GSTs show affinities 10(2)-10(4) times lower, not sufficient for this purpose. The NO sensitivity of bacteria that express only Cys-based GSTs could be related to the low or null affinity of their GSTs for DNDGIC. GSTs with the highest affinity (Tyr-based GSTs) are also over-represented in the perinuclear region of mammalian cells, possibly for nucleus protection. On the basis of these results we propose that GST evolution in higher organisms could be linked to the defense against NO.
Keywords: Dinitrosyl Iron Complex; Enzyme Inhibitors; Enzyme Structure; Enzymes; Evolution; Glutathione Transferase; Nitric Oxide.
Figures
Similar articles
-
The specific interaction of dinitrosyl-diglutathionyl-iron complex, a natural NO carrier, with the glutathione transferase superfamily: suggestion for an evolutionary pressure in the direction of the storage of nitric oxide.J Biol Chem. 2003 Oct 24;278(43):42283-93. doi: 10.1074/jbc.M305568200. Epub 2003 Jul 18. J Biol Chem. 2003. PMID: 12871945
-
Glutathione transferases sequester toxic dinitrosyl-iron complexes in cells. A protection mechanism against excess nitric oxide.J Biol Chem. 2007 Mar 2;282(9):6364-71. doi: 10.1074/jbc.M609905200. Epub 2006 Dec 30. J Biol Chem. 2007. PMID: 17197702
-
Evolution of Negative Cooperativity in Glutathione Transferase Enabled Preservation of Enzyme Function.J Biol Chem. 2016 Dec 23;291(52):26739-26749. doi: 10.1074/jbc.M116.749507. Epub 2016 Nov 4. J Biol Chem. 2016. PMID: 27815499 Free PMC article.
-
The good Samaritan glutathione-S-transferase P1: An evolving relationship in nitric oxide metabolism mediated by the direct interactions between multiple effector molecules.Redox Biol. 2023 Feb;59:102568. doi: 10.1016/j.redox.2022.102568. Epub 2022 Dec 15. Redox Biol. 2023. PMID: 36563536 Free PMC article. Review.
-
Structure, function and evolution of glutathione transferases: implications for classification of non-mammalian members of an ancient enzyme superfamily.Biochem J. 2001 Nov 15;360(Pt 1):1-16. doi: 10.1042/0264-6021:3600001. Biochem J. 2001. PMID: 11695986 Free PMC article. Review.
Cited by
-
Glutathione transferase P1 is modified by palmitate.PLoS One. 2024 Sep 13;19(9):e0308500. doi: 10.1371/journal.pone.0308500. eCollection 2024. PLoS One. 2024. PMID: 39269939 Free PMC article.
-
Inactivation of human salivary glutathione transferase P1-1 by hypothiocyanite: a post-translational control system in search of a role.PLoS One. 2014 Nov 13;9(11):e112797. doi: 10.1371/journal.pone.0112797. eCollection 2014. PLoS One. 2014. PMID: 25393952 Free PMC article. Clinical Trial.
-
Glutathione Transferase P1-1 an Enzyme Useful in Biomedicine and as Biomarker in Clinical Practice and in Environmental Pollution.Nutrients. 2019 Jul 27;11(8):1741. doi: 10.3390/nu11081741. Nutrients. 2019. PMID: 31357662 Free PMC article. Review.
-
The Peroxidatic Thiol of Peroxiredoxin 1 is Nitrosated by Nitrosoglutathione but Coordinates to the Dinitrosyl Iron Complex of Glutathione.Antioxidants (Basel). 2020 Mar 25;9(4):276. doi: 10.3390/antiox9040276. Antioxidants (Basel). 2020. PMID: 32218363 Free PMC article.
-
Glutathione-S-Transferases as Potential Targets for Modulation of Nitric Oxide-Mediated Vasodilation.Biomolecules. 2022 Sep 13;12(9):1292. doi: 10.3390/biom12091292. Biomolecules. 2022. PMID: 36139130 Free PMC article.
References
-
- Armstrong R. N. (1997) Structure, catalytic mechanism, and evolution of the glutathione transferases. Chem. Res. Toxicol. 10, 2–18 - PubMed
-
- Hayes J. D., Flanagan J. U., Jowsey I. R. (2005) Glutathione transferases. Annu. Rev. Pharmacol. Toxicol. 45, 51–88 - PubMed
-
- Mannervik B., Board P. G., Hayes J. D., Listowsky I., Pearson W. R. (2005) Nomenclature for mammalian soluble glutathione transferases. Methods Enzymol. 401, 1–8 - PubMed
Publication types
MeSH terms
Substances
Grants and funding
LinkOut - more resources
Full Text Sources
Other Literature Sources
Research Materials
Miscellaneous
